Yakama vs Greek Hearing Disability
COMPARE
Yakama
Greek
Hearing Disability
Hearing Disability Comparison
Yakama
Greeks
3.9%
HEARING DISABILITY
0.0/ 100
METRIC RATING
314th/ 347
METRIC RANK
3.2%
HEARING DISABILITY
3.2/ 100
METRIC RATING
230th/ 347
METRIC RANK
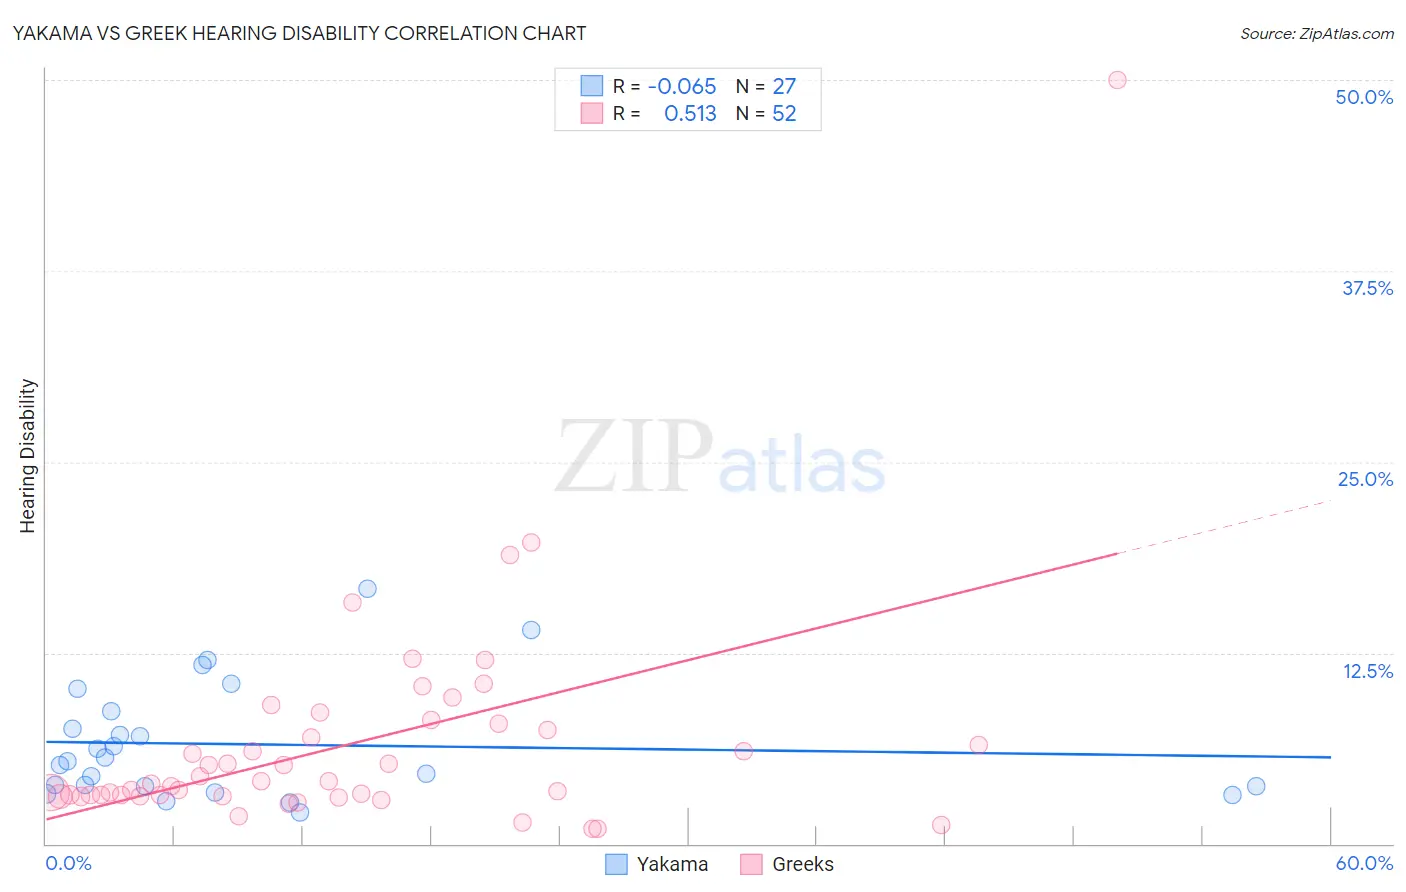
Yakama vs Greek Hearing Disability Correlation Chart
The statistical analysis conducted on geographies consisting of 19,917,800 people shows a slight negative correlation between the proportion of Yakama and percentage of population with hearing disability in the United States with a correlation coefficient (R) of -0.065 and weighted average of 3.9%. Similarly, the statistical analysis conducted on geographies consisting of 482,523,980 people shows a substantial positive correlation between the proportion of Greeks and percentage of population with hearing disability in the United States with a correlation coefficient (R) of 0.513 and weighted average of 3.2%, a difference of 22.1%.
Hearing Disability Correlation Summary
| Measurement | Yakama | Greek |
| Minimum | 2.0% | 1.0% |
| Maximum | 16.7% | 50.0% |
| Range | 14.6% | 49.0% |
| Mean | 6.5% | 6.5% |
| Median | 5.4% | 4.0% |
| Interquartile 25% (IQ1) | 3.7% | 3.2% |
| Interquartile 75% (IQ3) | 8.6% | 7.6% |
| Interquartile Range (IQR) | 4.9% | 4.5% |
| Standard Deviation (Sample) | 3.8% | 7.4% |
| Standard Deviation (Population) | 3.7% | 7.4% |
Similar Demographics by Hearing Disability
Demographics Similar to Yakama by Hearing Disability
In terms of hearing disability, the demographic groups most similar to Yakama are Puget Sound Salish (3.9%, a difference of 0.010%), Hopi (3.9%, a difference of 0.17%), Spanish American (4.0%, a difference of 0.21%), Cajun (3.9%, a difference of 0.28%), and Comanche (4.0%, a difference of 0.34%).
| Demographics | Rating | Rank | Hearing Disability |
| French Canadians | 0.0 /100 | #307 | Tragic 3.8% |
| Ottawa | 0.0 /100 | #308 | Tragic 3.8% |
| Scotch-Irish | 0.0 /100 | #309 | Tragic 3.8% |
| Cree | 0.0 /100 | #310 | Tragic 3.8% |
| Americans | 0.0 /100 | #311 | Tragic 3.9% |
| Cajuns | 0.0 /100 | #312 | Tragic 3.9% |
| Hopi | 0.0 /100 | #313 | Tragic 3.9% |
| Yakama | 0.0 /100 | #314 | Tragic 3.9% |
| Puget Sound Salish | 0.0 /100 | #315 | Tragic 3.9% |
| Spanish Americans | 0.0 /100 | #316 | Tragic 4.0% |
| Comanche | 0.0 /100 | #317 | Tragic 4.0% |
| Cheyenne | 0.0 /100 | #318 | Tragic 4.0% |
| Chippewa | 0.0 /100 | #319 | Tragic 4.0% |
| Shoshone | 0.0 /100 | #320 | Tragic 4.0% |
| Paiute | 0.0 /100 | #321 | Tragic 4.1% |
Demographics Similar to Greeks by Hearing Disability
In terms of hearing disability, the demographic groups most similar to Greeks are Luxembourger (3.2%, a difference of 0.23%), Ukrainian (3.2%, a difference of 0.28%), Maltese (3.2%, a difference of 0.51%), Immigrants from Portugal (3.2%, a difference of 0.62%), and Estonian (3.3%, a difference of 0.65%).
| Demographics | Rating | Rank | Hearing Disability |
| Mexicans | 5.6 /100 | #223 | Tragic 3.2% |
| Icelanders | 5.2 /100 | #224 | Tragic 3.2% |
| Latvians | 5.1 /100 | #225 | Tragic 3.2% |
| Lebanese | 5.0 /100 | #226 | Tragic 3.2% |
| Bhutanese | 4.6 /100 | #227 | Tragic 3.2% |
| Immigrants | Portugal | 4.3 /100 | #228 | Tragic 3.2% |
| Maltese | 4.1 /100 | #229 | Tragic 3.2% |
| Greeks | 3.2 /100 | #230 | Tragic 3.2% |
| Luxembourgers | 2.9 /100 | #231 | Tragic 3.2% |
| Ukrainians | 2.9 /100 | #232 | Tragic 3.2% |
| Estonians | 2.4 /100 | #233 | Tragic 3.3% |
| Central American Indians | 2.3 /100 | #234 | Tragic 3.3% |
| Guamanians/Chamorros | 2.2 /100 | #235 | Tragic 3.3% |
| Serbians | 2.2 /100 | #236 | Tragic 3.3% |
| Immigrants | Austria | 1.8 /100 | #237 | Tragic 3.3% |