Immigrants from Thailand vs White/Caucasian Hearing Disability
COMPARE
Immigrants from Thailand
White/Caucasian
Hearing Disability
Hearing Disability Comparison
Immigrants from Thailand
Whites/Caucasians
3.1%
HEARING DISABILITY
16.4/ 100
METRIC RATING
202nd/ 347
METRIC RANK
3.7%
HEARING DISABILITY
0.0/ 100
METRIC RATING
290th/ 347
METRIC RANK
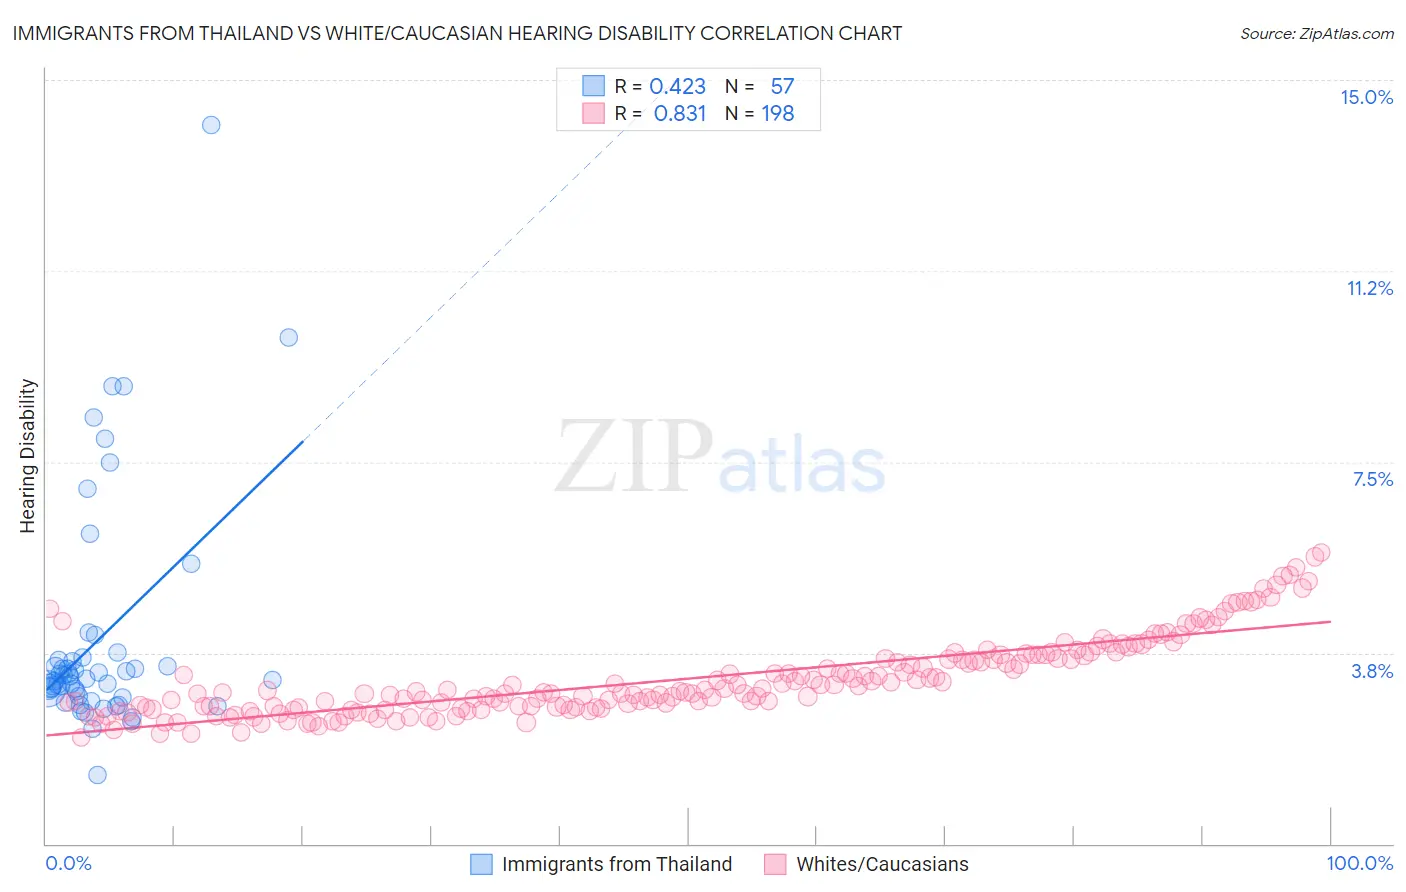
Immigrants from Thailand vs White/Caucasian Hearing Disability Correlation Chart
The statistical analysis conducted on geographies consisting of 316,957,288 people shows a moderate positive correlation between the proportion of Immigrants from Thailand and percentage of population with hearing disability in the United States with a correlation coefficient (R) of 0.423 and weighted average of 3.1%. Similarly, the statistical analysis conducted on geographies consisting of 582,250,050 people shows a very strong positive correlation between the proportion of Whites/Caucasians and percentage of population with hearing disability in the United States with a correlation coefficient (R) of 0.831 and weighted average of 3.7%, a difference of 18.5%.
Hearing Disability Correlation Summary
| Measurement | Immigrants from Thailand | White/Caucasian |
| Minimum | 1.3% | 2.1% |
| Maximum | 14.1% | 5.7% |
| Range | 12.8% | 3.6% |
| Mean | 4.0% | 3.2% |
| Median | 3.2% | 3.0% |
| Interquartile 25% (IQ1) | 2.9% | 2.7% |
| Interquartile 75% (IQ3) | 3.6% | 3.7% |
| Interquartile Range (IQR) | 0.74% | 1.0% |
| Standard Deviation (Sample) | 2.3% | 0.77% |
| Standard Deviation (Population) | 2.3% | 0.77% |
Similar Demographics by Hearing Disability
Demographics Similar to Immigrants from Thailand by Hearing Disability
In terms of hearing disability, the demographic groups most similar to Immigrants from Thailand are Immigrants from Denmark (3.1%, a difference of 0.040%), Immigrants from Czechoslovakia (3.1%, a difference of 0.090%), Alsatian (3.1%, a difference of 0.090%), Eastern European (3.1%, a difference of 0.16%), and Hispanic or Latino (3.1%, a difference of 0.22%).
| Demographics | Rating | Rank | Hearing Disability |
| Spanish American Indians | 24.1 /100 | #195 | Fair 3.1% |
| Immigrants | Europe | 22.9 /100 | #196 | Fair 3.1% |
| Immigrants | Bosnia and Herzegovina | 20.6 /100 | #197 | Fair 3.1% |
| Immigrants | Croatia | 20.5 /100 | #198 | Fair 3.1% |
| Syrians | 19.2 /100 | #199 | Poor 3.1% |
| Immigrants | North Macedonia | 19.1 /100 | #200 | Poor 3.1% |
| Iraqis | 19.0 /100 | #201 | Poor 3.1% |
| Immigrants | Thailand | 16.4 /100 | #202 | Poor 3.1% |
| Immigrants | Denmark | 16.2 /100 | #203 | Poor 3.1% |
| Immigrants | Czechoslovakia | 15.9 /100 | #204 | Poor 3.1% |
| Alsatians | 15.9 /100 | #205 | Poor 3.1% |
| Eastern Europeans | 15.5 /100 | #206 | Poor 3.1% |
| Hispanics or Latinos | 15.1 /100 | #207 | Poor 3.1% |
| Immigrants | Latvia | 12.7 /100 | #208 | Poor 3.1% |
| Immigrants | Hungary | 12.5 /100 | #209 | Poor 3.1% |
Demographics Similar to Whites/Caucasians by Hearing Disability
In terms of hearing disability, the demographic groups most similar to Whites/Caucasians are Finnish (3.7%, a difference of 0.010%), Native Hawaiian (3.7%, a difference of 0.080%), Chinese (3.7%, a difference of 0.13%), Norwegian (3.7%, a difference of 0.13%), and Irish (3.7%, a difference of 0.34%).
| Demographics | Rating | Rank | Hearing Disability |
| Blackfeet | 0.0 /100 | #283 | Tragic 3.6% |
| Immigrants | Micronesia | 0.0 /100 | #284 | Tragic 3.6% |
| Sioux | 0.0 /100 | #285 | Tragic 3.6% |
| Delaware | 0.0 /100 | #286 | Tragic 3.6% |
| Spanish | 0.0 /100 | #287 | Tragic 3.7% |
| Irish | 0.0 /100 | #288 | Tragic 3.7% |
| Chinese | 0.0 /100 | #289 | Tragic 3.7% |
| Whites/Caucasians | 0.0 /100 | #290 | Tragic 3.7% |
| Finns | 0.0 /100 | #291 | Tragic 3.7% |
| Native Hawaiians | 0.0 /100 | #292 | Tragic 3.7% |
| Norwegians | 0.0 /100 | #293 | Tragic 3.7% |
| Iroquois | 0.0 /100 | #294 | Tragic 3.7% |
| Welsh | 0.0 /100 | #295 | Tragic 3.7% |
| Pima | 0.0 /100 | #296 | Tragic 3.7% |
| Immigrants | Azores | 0.0 /100 | #297 | Tragic 3.7% |