Yakama vs White/Caucasian 8th Grade
COMPARE
Yakama
White/Caucasian
8th Grade
8th Grade Comparison
Yakama
Whites/Caucasians
91.2%
8TH GRADE
0.0/ 100
METRIC RATING
340th/ 347
METRIC RANK
96.7%
8TH GRADE
99.8/ 100
METRIC RATING
62nd/ 347
METRIC RANK
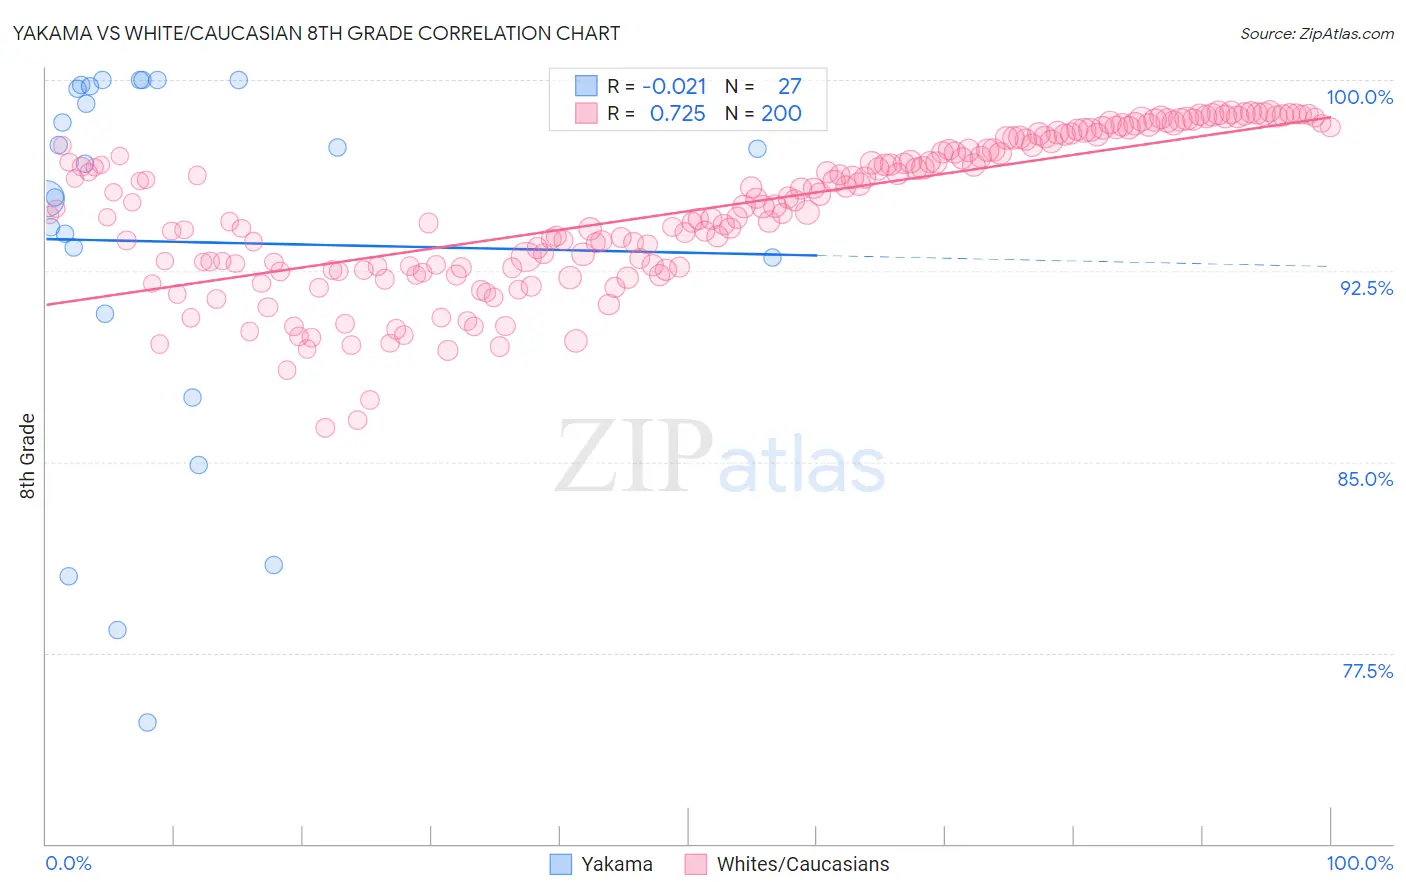
Yakama vs White/Caucasian 8th Grade Correlation Chart
The statistical analysis conducted on geographies consisting of 19,923,144 people shows no correlation between the proportion of Yakama and percentage of population with at least 8th grade education in the United States with a correlation coefficient (R) of -0.021 and weighted average of 91.2%. Similarly, the statistical analysis conducted on geographies consisting of 585,246,768 people shows a strong positive correlation between the proportion of Whites/Caucasians and percentage of population with at least 8th grade education in the United States with a correlation coefficient (R) of 0.725 and weighted average of 96.7%, a difference of 5.9%.
8th Grade Correlation Summary
| Measurement | Yakama | White/Caucasian |
| Minimum | 74.8% | 86.3% |
| Maximum | 100.0% | 98.8% |
| Range | 25.2% | 12.4% |
| Mean | 93.7% | 94.9% |
| Median | 96.7% | 95.0% |
| Interquartile 25% (IQ1) | 90.8% | 92.6% |
| Interquartile 75% (IQ3) | 99.8% | 97.5% |
| Interquartile Range (IQR) | 9.0% | 4.9% |
| Standard Deviation (Sample) | 7.5% | 2.9% |
| Standard Deviation (Population) | 7.4% | 2.9% |
Similar Demographics by 8th Grade
Demographics Similar to Yakama by 8th Grade
In terms of 8th grade, the demographic groups most similar to Yakama are Guatemalan (91.1%, a difference of 0.11%), Mexican (91.4%, a difference of 0.13%), Central American (91.6%, a difference of 0.36%), Salvadoran (90.9%, a difference of 0.40%), and Immigrants from Latin America (91.7%, a difference of 0.50%).
| Demographics | Rating | Rank | 8th Grade |
| Hispanics or Latinos | 0.0 /100 | #333 | Tragic 92.2% |
| Immigrants | Yemen | 0.0 /100 | #334 | Tragic 92.1% |
| Mexican American Indians | 0.0 /100 | #335 | Tragic 92.1% |
| Immigrants | Honduras | 0.0 /100 | #336 | Tragic 91.9% |
| Immigrants | Latin America | 0.0 /100 | #337 | Tragic 91.7% |
| Central Americans | 0.0 /100 | #338 | Tragic 91.6% |
| Mexicans | 0.0 /100 | #339 | Tragic 91.4% |
| Yakama | 0.0 /100 | #340 | Tragic 91.2% |
| Guatemalans | 0.0 /100 | #341 | Tragic 91.1% |
| Salvadorans | 0.0 /100 | #342 | Tragic 90.9% |
| Immigrants | Guatemala | 0.0 /100 | #343 | Tragic 90.7% |
| Immigrants | Central America | 0.0 /100 | #344 | Tragic 90.4% |
| Immigrants | El Salvador | 0.0 /100 | #345 | Tragic 90.3% |
| Immigrants | Mexico | 0.0 /100 | #346 | Tragic 90.2% |
| Spanish American Indians | 0.0 /100 | #347 | Tragic 89.8% |
Demographics Similar to Whites/Caucasians by 8th Grade
In terms of 8th grade, the demographic groups most similar to Whites/Caucasians are Immigrants from Austria (96.7%, a difference of 0.010%), Immigrants from North America (96.7%, a difference of 0.020%), Immigrants from Northern Europe (96.7%, a difference of 0.020%), Ukrainian (96.7%, a difference of 0.020%), and Immigrants from India (96.6%, a difference of 0.020%).
| Demographics | Rating | Rank | 8th Grade |
| Russians | 99.8 /100 | #55 | Exceptional 96.7% |
| Australians | 99.8 /100 | #56 | Exceptional 96.7% |
| Macedonians | 99.8 /100 | #57 | Exceptional 96.7% |
| Immigrants | Canada | 99.8 /100 | #58 | Exceptional 96.7% |
| Immigrants | North America | 99.8 /100 | #59 | Exceptional 96.7% |
| Immigrants | Northern Europe | 99.8 /100 | #60 | Exceptional 96.7% |
| Immigrants | Austria | 99.8 /100 | #61 | Exceptional 96.7% |
| Whites/Caucasians | 99.8 /100 | #62 | Exceptional 96.7% |
| Ukrainians | 99.7 /100 | #63 | Exceptional 96.7% |
| Immigrants | India | 99.7 /100 | #64 | Exceptional 96.6% |
| Native Hawaiians | 99.7 /100 | #65 | Exceptional 96.6% |
| Canadians | 99.7 /100 | #66 | Exceptional 96.6% |
| Iranians | 99.7 /100 | #67 | Exceptional 96.6% |
| Creek | 99.7 /100 | #68 | Exceptional 96.6% |
| Americans | 99.7 /100 | #69 | Exceptional 96.6% |