Yakama vs White/Caucasian Child Poverty Among Girls Under 16
COMPARE
Yakama
White/Caucasian
Child Poverty Among Girls Under 16
Child Poverty Among Girls Under 16 Comparison
Yakama
Whites/Caucasians
22.6%
CHILD POVERTY AMONG GIRLS UNDER 16
0.0/ 100
METRIC RATING
322nd/ 347
METRIC RANK
16.6%
CHILD POVERTY AMONG GIRLS UNDER 16
43.6/ 100
METRIC RATING
178th/ 347
METRIC RANK
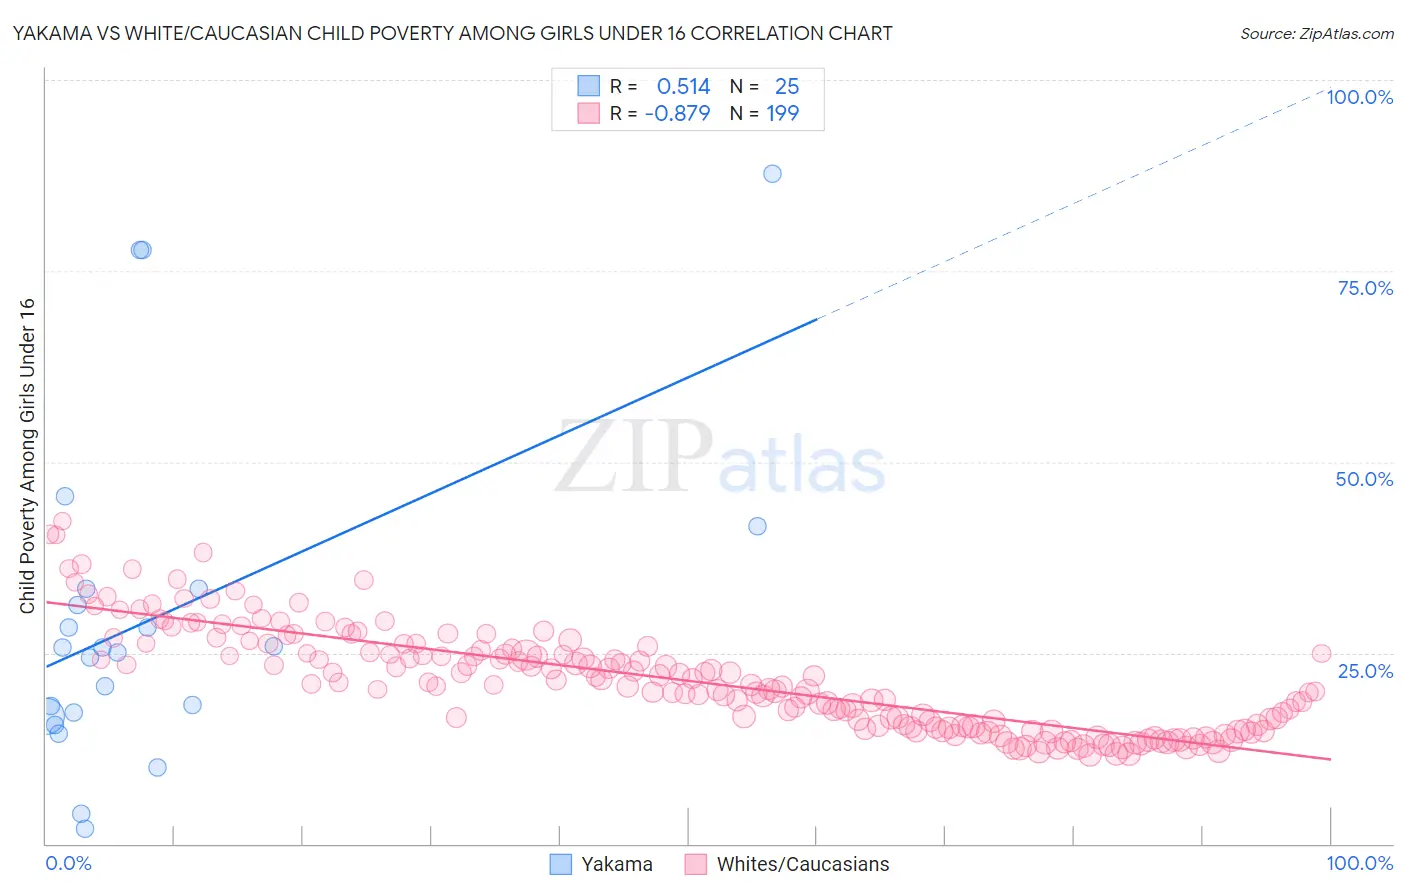
Yakama vs White/Caucasian Child Poverty Among Girls Under 16 Correlation Chart
The statistical analysis conducted on geographies consisting of 19,841,501 people shows a substantial positive correlation between the proportion of Yakama and poverty level among girls under the age of 16 in the United States with a correlation coefficient (R) of 0.514 and weighted average of 22.6%. Similarly, the statistical analysis conducted on geographies consisting of 558,680,954 people shows a very strong negative correlation between the proportion of Whites/Caucasians and poverty level among girls under the age of 16 in the United States with a correlation coefficient (R) of -0.879 and weighted average of 16.6%, a difference of 36.0%.
Child Poverty Among Girls Under 16 Correlation Summary
| Measurement | Yakama | White/Caucasian |
| Minimum | 2.0% | 11.7% |
| Maximum | 87.7% | 42.2% |
| Range | 85.7% | 30.5% |
| Mean | 29.9% | 21.4% |
| Median | 25.6% | 20.7% |
| Interquartile 25% (IQ1) | 17.0% | 15.2% |
| Interquartile 75% (IQ3) | 33.3% | 25.5% |
| Interquartile Range (IQR) | 16.3% | 10.3% |
| Standard Deviation (Sample) | 21.8% | 6.8% |
| Standard Deviation (Population) | 21.4% | 6.7% |
Similar Demographics by Child Poverty Among Girls Under 16
Demographics Similar to Yakama by Child Poverty Among Girls Under 16
In terms of child poverty among girls under 16, the demographic groups most similar to Yakama are Cajun (22.6%, a difference of 0.020%), Colville (22.5%, a difference of 0.19%), Paiute (22.6%, a difference of 0.31%), Immigrants from Congo (22.7%, a difference of 0.80%), and Immigrants from Honduras (22.8%, a difference of 0.93%).
| Demographics | Rating | Rank | Child Poverty Among Girls Under 16 |
| Ute | 0.0 /100 | #315 | Tragic 21.8% |
| Immigrants | Guatemala | 0.0 /100 | #316 | Tragic 21.9% |
| Africans | 0.0 /100 | #317 | Tragic 21.9% |
| Immigrants | Dominica | 0.0 /100 | #318 | Tragic 22.1% |
| U.S. Virgin Islanders | 0.0 /100 | #319 | Tragic 22.1% |
| Hondurans | 0.0 /100 | #320 | Tragic 22.2% |
| Colville | 0.0 /100 | #321 | Tragic 22.5% |
| Yakama | 0.0 /100 | #322 | Tragic 22.6% |
| Cajuns | 0.0 /100 | #323 | Tragic 22.6% |
| Paiute | 0.0 /100 | #324 | Tragic 22.6% |
| Immigrants | Congo | 0.0 /100 | #325 | Tragic 22.7% |
| Immigrants | Honduras | 0.0 /100 | #326 | Tragic 22.8% |
| Central American Indians | 0.0 /100 | #327 | Tragic 22.8% |
| Dominicans | 0.0 /100 | #328 | Tragic 23.7% |
| Kiowa | 0.0 /100 | #329 | Tragic 23.7% |
Demographics Similar to Whites/Caucasians by Child Poverty Among Girls Under 16
In terms of child poverty among girls under 16, the demographic groups most similar to Whites/Caucasians are Hawaiian (16.6%, a difference of 0.030%), Immigrants from Syria (16.6%, a difference of 0.040%), Immigrants from Western Asia (16.6%, a difference of 0.060%), Immigrants from Iraq (16.6%, a difference of 0.060%), and Immigrants from Ethiopia (16.6%, a difference of 0.070%).
| Demographics | Rating | Rank | Child Poverty Among Girls Under 16 |
| Immigrants | Saudi Arabia | 64.0 /100 | #171 | Good 16.2% |
| Afghans | 62.3 /100 | #172 | Good 16.2% |
| Immigrants | South America | 55.1 /100 | #173 | Average 16.4% |
| Ethiopians | 50.0 /100 | #174 | Average 16.5% |
| Lebanese | 45.4 /100 | #175 | Average 16.6% |
| Hungarians | 45.1 /100 | #176 | Average 16.6% |
| Immigrants | Western Asia | 44.1 /100 | #177 | Average 16.6% |
| Whites/Caucasians | 43.6 /100 | #178 | Average 16.6% |
| Hawaiians | 43.4 /100 | #179 | Average 16.6% |
| Immigrants | Syria | 43.3 /100 | #180 | Average 16.6% |
| Immigrants | Iraq | 43.2 /100 | #181 | Average 16.6% |
| Immigrants | Ethiopia | 43.1 /100 | #182 | Average 16.6% |
| Immigrants | Portugal | 42.5 /100 | #183 | Average 16.6% |
| Scotch-Irish | 39.6 /100 | #184 | Fair 16.7% |
| Immigrants | Uruguay | 35.6 /100 | #185 | Fair 16.7% |