Yakama vs Immigrants from Mexico Disability
COMPARE
Yakama
Immigrants from Mexico
Disability
Disability Comparison
Yakama
Immigrants from Mexico
13.4%
DISABILITY
0.0/ 100
METRIC RATING
304th/ 347
METRIC RANK
11.9%
DISABILITY
23.8/ 100
METRIC RATING
188th/ 347
METRIC RANK
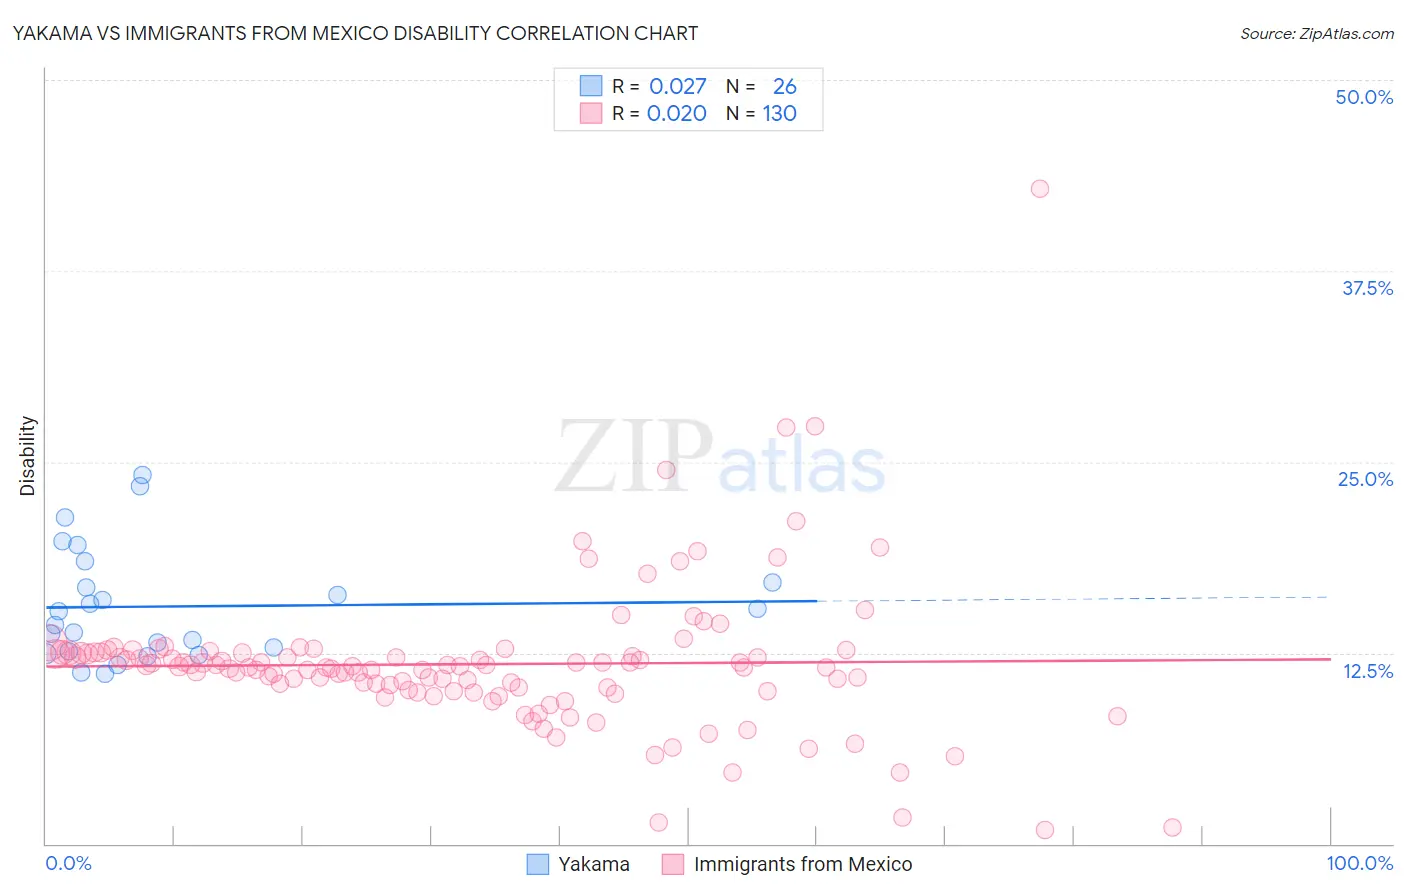
Yakama vs Immigrants from Mexico Disability Correlation Chart
The statistical analysis conducted on geographies consisting of 19,917,759 people shows no correlation between the proportion of Yakama and percentage of population with a disability in the United States with a correlation coefficient (R) of 0.027 and weighted average of 13.4%. Similarly, the statistical analysis conducted on geographies consisting of 513,610,494 people shows no correlation between the proportion of Immigrants from Mexico and percentage of population with a disability in the United States with a correlation coefficient (R) of 0.020 and weighted average of 11.9%, a difference of 12.9%.
Disability Correlation Summary
| Measurement | Yakama | Immigrants from Mexico |
| Minimum | 11.1% | 0.89% |
| Maximum | 24.1% | 42.9% |
| Range | 13.0% | 42.0% |
| Mean | 15.5% | 11.8% |
| Median | 14.7% | 11.6% |
| Interquartile 25% (IQ1) | 12.6% | 10.1% |
| Interquartile 75% (IQ3) | 17.1% | 12.5% |
| Interquartile Range (IQR) | 4.5% | 2.4% |
| Standard Deviation (Sample) | 3.7% | 4.9% |
| Standard Deviation (Population) | 3.6% | 4.8% |
Similar Demographics by Disability
Demographics Similar to Yakama by Disability
In terms of disability, the demographic groups most similar to Yakama are French Canadian (13.4%, a difference of 0.35%), Scotch-Irish (13.3%, a difference of 0.47%), Cape Verdean (13.5%, a difference of 0.95%), Shoshone (13.5%, a difference of 1.0%), and French American Indian (13.5%, a difference of 1.1%).
| Demographics | Rating | Rank | Disability |
| Hopi | 0.0 /100 | #297 | Tragic 13.2% |
| Alaska Natives | 0.0 /100 | #298 | Tragic 13.2% |
| French | 0.0 /100 | #299 | Tragic 13.2% |
| Pennsylvania Germans | 0.0 /100 | #300 | Tragic 13.2% |
| Immigrants | Micronesia | 0.0 /100 | #301 | Tragic 13.2% |
| Arapaho | 0.0 /100 | #302 | Tragic 13.2% |
| Scotch-Irish | 0.0 /100 | #303 | Tragic 13.3% |
| Yakama | 0.0 /100 | #304 | Tragic 13.4% |
| French Canadians | 0.0 /100 | #305 | Tragic 13.4% |
| Cape Verdeans | 0.0 /100 | #306 | Tragic 13.5% |
| Shoshone | 0.0 /100 | #307 | Tragic 13.5% |
| French American Indians | 0.0 /100 | #308 | Tragic 13.5% |
| Tlingit-Haida | 0.0 /100 | #309 | Tragic 13.5% |
| Blackfeet | 0.0 /100 | #310 | Tragic 13.6% |
| Delaware | 0.0 /100 | #311 | Tragic 13.6% |
Demographics Similar to Immigrants from Mexico by Disability
In terms of disability, the demographic groups most similar to Immigrants from Mexico are Immigrants from Zaire (11.9%, a difference of 0.12%), Immigrants from West Indies (11.9%, a difference of 0.17%), Lebanese (11.8%, a difference of 0.24%), Immigrants from Scotland (11.8%, a difference of 0.26%), and Immigrants from Burma/Myanmar (11.8%, a difference of 0.27%).
| Demographics | Rating | Rank | Disability |
| Immigrants | Oceania | 34.3 /100 | #181 | Fair 11.8% |
| Icelanders | 34.0 /100 | #182 | Fair 11.8% |
| Hondurans | 31.2 /100 | #183 | Fair 11.8% |
| Iraqis | 30.0 /100 | #184 | Fair 11.8% |
| Immigrants | Burma/Myanmar | 28.5 /100 | #185 | Fair 11.8% |
| Immigrants | Scotland | 28.2 /100 | #186 | Fair 11.8% |
| Lebanese | 27.9 /100 | #187 | Fair 11.8% |
| Immigrants | Mexico | 23.8 /100 | #188 | Fair 11.9% |
| Immigrants | Zaire | 21.8 /100 | #189 | Fair 11.9% |
| Immigrants | West Indies | 21.1 /100 | #190 | Fair 11.9% |
| Ute | 19.5 /100 | #191 | Poor 11.9% |
| Lithuanians | 18.8 /100 | #192 | Poor 11.9% |
| Immigrants | Bosnia and Herzegovina | 18.0 /100 | #193 | Poor 11.9% |
| Somalis | 17.3 /100 | #194 | Poor 11.9% |
| Barbadians | 15.8 /100 | #195 | Poor 11.9% |