Yakama vs Immigrants from Fiji Disability
COMPARE
Yakama
Immigrants from Fiji
Disability
Disability Comparison
Yakama
Immigrants from Fiji
13.4%
DISABILITY
0.0/ 100
METRIC RATING
304th/ 347
METRIC RANK
11.6%
DISABILITY
69.5/ 100
METRIC RATING
156th/ 347
METRIC RANK
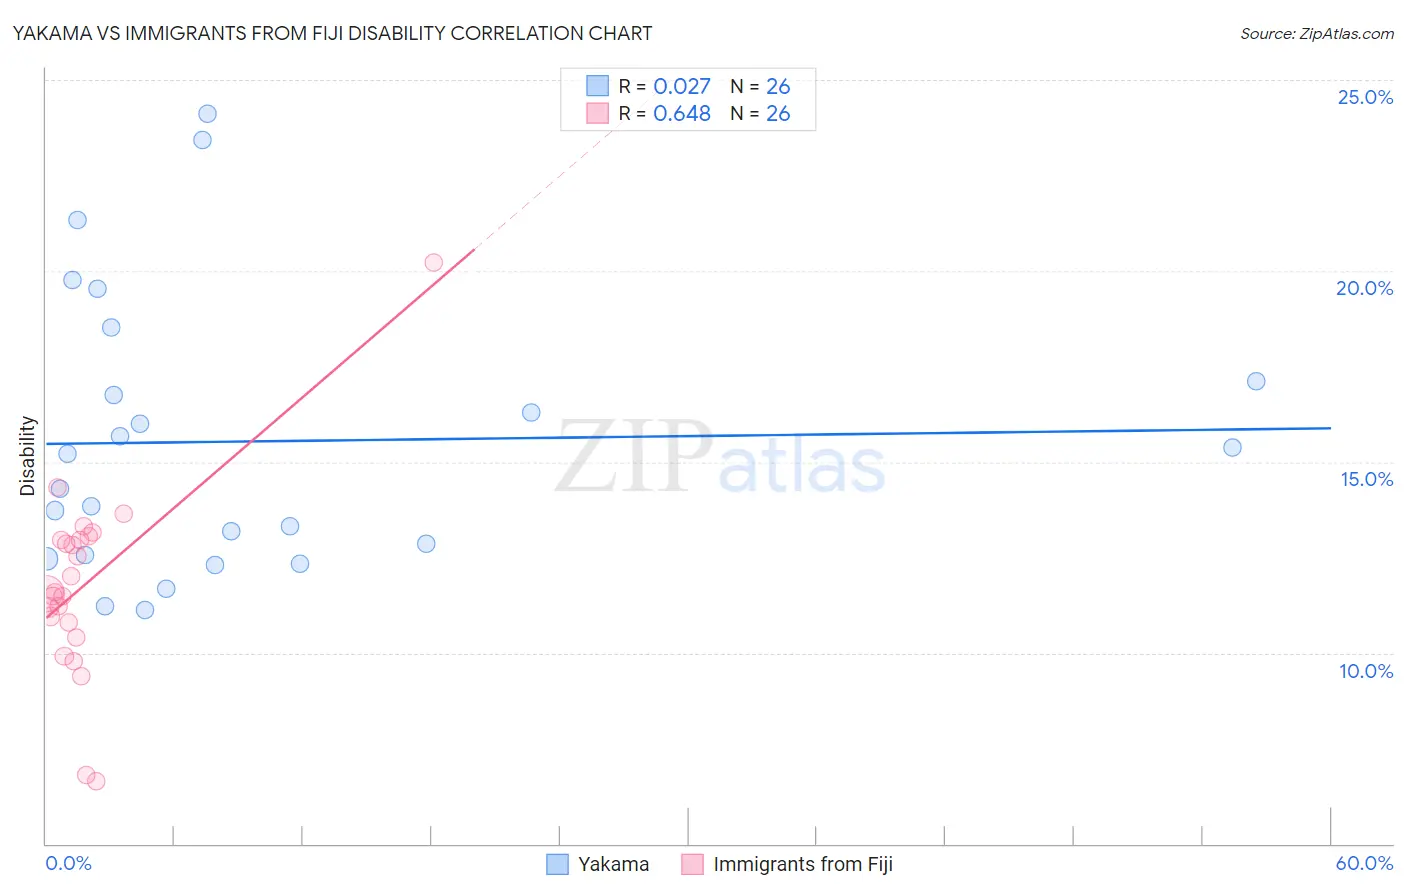
Yakama vs Immigrants from Fiji Disability Correlation Chart
The statistical analysis conducted on geographies consisting of 19,917,759 people shows no correlation between the proportion of Yakama and percentage of population with a disability in the United States with a correlation coefficient (R) of 0.027 and weighted average of 13.4%. Similarly, the statistical analysis conducted on geographies consisting of 93,755,847 people shows a significant positive correlation between the proportion of Immigrants from Fiji and percentage of population with a disability in the United States with a correlation coefficient (R) of 0.648 and weighted average of 11.6%, a difference of 15.4%.
Disability Correlation Summary
| Measurement | Yakama | Immigrants from Fiji |
| Minimum | 11.1% | 6.6% |
| Maximum | 24.1% | 20.2% |
| Range | 13.0% | 13.6% |
| Mean | 15.5% | 11.8% |
| Median | 14.7% | 11.6% |
| Interquartile 25% (IQ1) | 12.6% | 10.8% |
| Interquartile 75% (IQ3) | 17.1% | 13.0% |
| Interquartile Range (IQR) | 4.5% | 2.2% |
| Standard Deviation (Sample) | 3.7% | 2.5% |
| Standard Deviation (Population) | 3.6% | 2.5% |
Similar Demographics by Disability
Demographics Similar to Yakama by Disability
In terms of disability, the demographic groups most similar to Yakama are French Canadian (13.4%, a difference of 0.35%), Scotch-Irish (13.3%, a difference of 0.47%), Cape Verdean (13.5%, a difference of 0.95%), Shoshone (13.5%, a difference of 1.0%), and French American Indian (13.5%, a difference of 1.1%).
| Demographics | Rating | Rank | Disability |
| Hopi | 0.0 /100 | #297 | Tragic 13.2% |
| Alaska Natives | 0.0 /100 | #298 | Tragic 13.2% |
| French | 0.0 /100 | #299 | Tragic 13.2% |
| Pennsylvania Germans | 0.0 /100 | #300 | Tragic 13.2% |
| Immigrants | Micronesia | 0.0 /100 | #301 | Tragic 13.2% |
| Arapaho | 0.0 /100 | #302 | Tragic 13.2% |
| Scotch-Irish | 0.0 /100 | #303 | Tragic 13.3% |
| Yakama | 0.0 /100 | #304 | Tragic 13.4% |
| French Canadians | 0.0 /100 | #305 | Tragic 13.4% |
| Cape Verdeans | 0.0 /100 | #306 | Tragic 13.5% |
| Shoshone | 0.0 /100 | #307 | Tragic 13.5% |
| French American Indians | 0.0 /100 | #308 | Tragic 13.5% |
| Tlingit-Haida | 0.0 /100 | #309 | Tragic 13.5% |
| Blackfeet | 0.0 /100 | #310 | Tragic 13.6% |
| Delaware | 0.0 /100 | #311 | Tragic 13.6% |
Demographics Similar to Immigrants from Fiji by Disability
In terms of disability, the demographic groups most similar to Immigrants from Fiji are Immigrants from Middle Africa (11.6%, a difference of 0.0%), Immigrants from Netherlands (11.6%, a difference of 0.010%), Immigrants from Ghana (11.6%, a difference of 0.090%), Immigrants from Guatemala (11.6%, a difference of 0.090%), and Immigrants from Kenya (11.6%, a difference of 0.14%).
| Demographics | Rating | Rank | Disability |
| Immigrants | Norway | 73.2 /100 | #149 | Good 11.6% |
| Romanians | 72.7 /100 | #150 | Good 11.6% |
| Immigrants | Kenya | 72.1 /100 | #151 | Good 11.6% |
| Immigrants | Moldova | 72.0 /100 | #152 | Good 11.6% |
| Immigrants | Ghana | 71.2 /100 | #153 | Good 11.6% |
| Immigrants | Guatemala | 71.1 /100 | #154 | Good 11.6% |
| Immigrants | Netherlands | 69.8 /100 | #155 | Good 11.6% |
| Immigrants | Fiji | 69.5 /100 | #156 | Good 11.6% |
| Immigrants | Middle Africa | 69.5 /100 | #157 | Good 11.6% |
| Armenians | 65.9 /100 | #158 | Good 11.6% |
| Guatemalans | 65.1 /100 | #159 | Good 11.6% |
| Immigrants | Barbados | 64.2 /100 | #160 | Good 11.6% |
| Immigrants | Cuba | 62.8 /100 | #161 | Good 11.6% |
| Immigrants | Haiti | 59.2 /100 | #162 | Average 11.7% |
| Immigrants | Trinidad and Tobago | 58.9 /100 | #163 | Average 11.7% |