Yakama vs Immigrants from Mexico 3rd Grade
COMPARE
Yakama
Immigrants from Mexico
3rd Grade
3rd Grade Comparison
Yakama
Immigrants from Mexico
95.9%
3RD GRADE
0.0/ 100
METRIC RATING
339th/ 347
METRIC RANK
95.8%
3RD GRADE
0.0/ 100
METRIC RATING
343rd/ 347
METRIC RANK
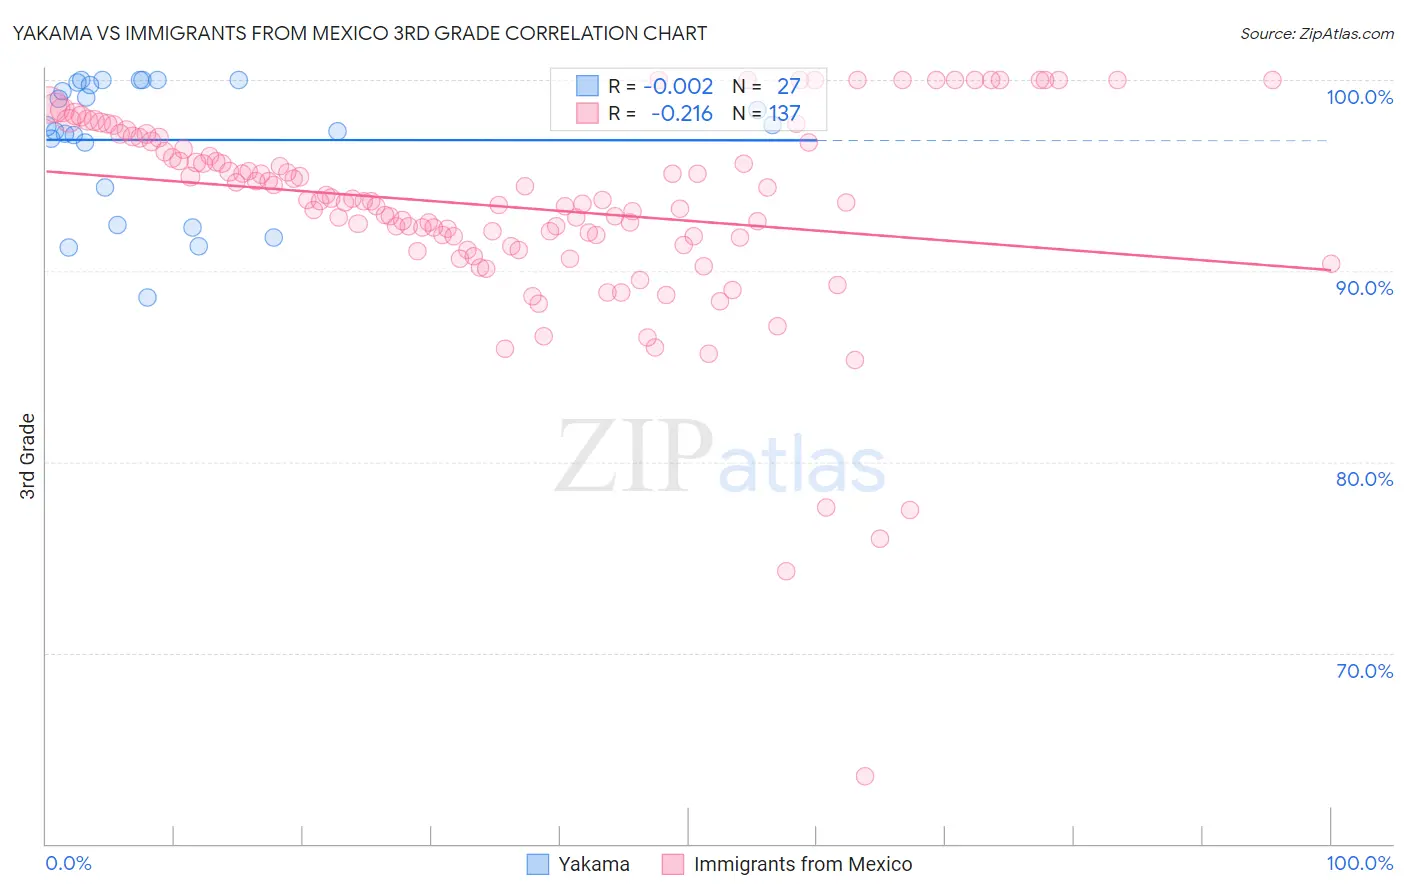
Yakama vs Immigrants from Mexico 3rd Grade Correlation Chart
The statistical analysis conducted on geographies consisting of 19,923,144 people shows no correlation between the proportion of Yakama and percentage of population with at least 3rd grade education in the United States with a correlation coefficient (R) of -0.002 and weighted average of 95.9%. Similarly, the statistical analysis conducted on geographies consisting of 513,767,657 people shows a weak negative correlation between the proportion of Immigrants from Mexico and percentage of population with at least 3rd grade education in the United States with a correlation coefficient (R) of -0.216 and weighted average of 95.8%, a difference of 0.17%.
3rd Grade Correlation Summary
| Measurement | Yakama | Immigrants from Mexico |
| Minimum | 88.6% | 63.5% |
| Maximum | 100.0% | 100.0% |
| Range | 11.4% | 36.5% |
| Mean | 96.9% | 93.4% |
| Median | 97.6% | 93.7% |
| Interquartile 25% (IQ1) | 94.4% | 91.8% |
| Interquartile 75% (IQ3) | 99.9% | 96.9% |
| Interquartile Range (IQR) | 5.5% | 5.1% |
| Standard Deviation (Sample) | 3.4% | 5.4% |
| Standard Deviation (Population) | 3.3% | 5.3% |
Demographics Similar to Yakama and Immigrants from Mexico by 3rd Grade
In terms of 3rd grade, the demographic groups most similar to Yakama are Guatemalan (96.0%, a difference of 0.030%), Nepalese (95.9%, a difference of 0.080%), Immigrants from Central America (95.8%, a difference of 0.13%), Immigrants from Guatemala (95.8%, a difference of 0.13%), and Central American (96.1%, a difference of 0.15%). Similarly, the demographic groups most similar to Immigrants from Mexico are Immigrants from Central America (95.8%, a difference of 0.040%), Immigrants from Guatemala (95.8%, a difference of 0.040%), Nepalese (95.9%, a difference of 0.090%), Salvadoran (95.7%, a difference of 0.11%), and Guatemalan (96.0%, a difference of 0.20%).
| Demographics | Rating | Rank | 3rd Grade |
| Bangladeshis | 0.0 /100 | #328 | Tragic 96.3% |
| Immigrants | Honduras | 0.0 /100 | #329 | Tragic 96.3% |
| Immigrants | Armenia | 0.0 /100 | #330 | Tragic 96.3% |
| Immigrants | Latin America | 0.0 /100 | #331 | Tragic 96.2% |
| Mexicans | 0.0 /100 | #332 | Tragic 96.2% |
| Immigrants | Fiji | 0.0 /100 | #333 | Tragic 96.2% |
| Immigrants | Cambodia | 0.0 /100 | #334 | Tragic 96.2% |
| Immigrants | Dominican Republic | 0.0 /100 | #335 | Tragic 96.2% |
| Immigrants | Cabo Verde | 0.0 /100 | #336 | Tragic 96.2% |
| Central Americans | 0.0 /100 | #337 | Tragic 96.1% |
| Guatemalans | 0.0 /100 | #338 | Tragic 96.0% |
| Yakama | 0.0 /100 | #339 | Tragic 95.9% |
| Nepalese | 0.0 /100 | #340 | Tragic 95.9% |
| Immigrants | Central America | 0.0 /100 | #341 | Tragic 95.8% |
| Immigrants | Guatemala | 0.0 /100 | #342 | Tragic 95.8% |
| Immigrants | Mexico | 0.0 /100 | #343 | Tragic 95.8% |
| Salvadorans | 0.0 /100 | #344 | Tragic 95.7% |
| Immigrants | Yemen | 0.0 /100 | #345 | Tragic 95.6% |
| Immigrants | El Salvador | 0.0 /100 | #346 | Tragic 95.5% |
| Spanish American Indians | 0.0 /100 | #347 | Tragic 95.3% |