Yakama vs European Disability
COMPARE
Yakama
European
Disability
Disability Comparison
Yakama
Europeans
13.4%
DISABILITY
0.0/ 100
METRIC RATING
304th/ 347
METRIC RANK
12.3%
DISABILITY
1.4/ 100
METRIC RATING
251st/ 347
METRIC RANK
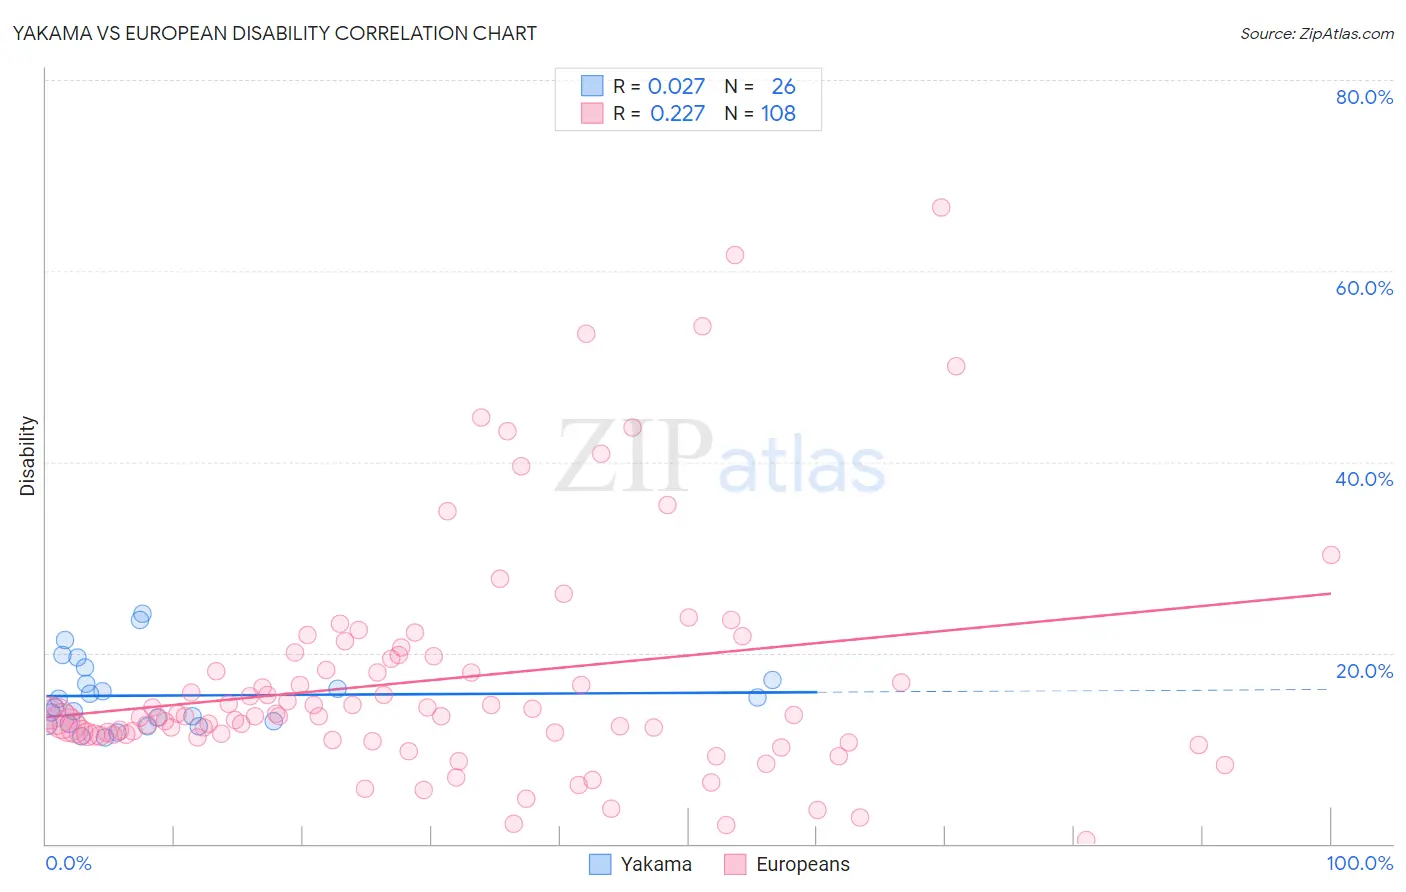
Yakama vs European Disability Correlation Chart
The statistical analysis conducted on geographies consisting of 19,917,759 people shows no correlation between the proportion of Yakama and percentage of population with a disability in the United States with a correlation coefficient (R) of 0.027 and weighted average of 13.4%. Similarly, the statistical analysis conducted on geographies consisting of 561,707,574 people shows a weak positive correlation between the proportion of Europeans and percentage of population with a disability in the United States with a correlation coefficient (R) of 0.227 and weighted average of 12.3%, a difference of 9.2%.
Disability Correlation Summary
| Measurement | Yakama | European |
| Minimum | 11.1% | 0.41% |
| Maximum | 24.1% | 66.7% |
| Range | 13.0% | 66.3% |
| Mean | 15.5% | 17.2% |
| Median | 14.7% | 13.4% |
| Interquartile 25% (IQ1) | 12.6% | 11.4% |
| Interquartile 75% (IQ3) | 17.1% | 19.6% |
| Interquartile Range (IQR) | 4.5% | 8.1% |
| Standard Deviation (Sample) | 3.7% | 12.4% |
| Standard Deviation (Population) | 3.6% | 12.3% |
Similar Demographics by Disability
Demographics Similar to Yakama by Disability
In terms of disability, the demographic groups most similar to Yakama are French Canadian (13.4%, a difference of 0.35%), Scotch-Irish (13.3%, a difference of 0.47%), Cape Verdean (13.5%, a difference of 0.95%), Shoshone (13.5%, a difference of 1.0%), and French American Indian (13.5%, a difference of 1.1%).
| Demographics | Rating | Rank | Disability |
| Hopi | 0.0 /100 | #297 | Tragic 13.2% |
| Alaska Natives | 0.0 /100 | #298 | Tragic 13.2% |
| French | 0.0 /100 | #299 | Tragic 13.2% |
| Pennsylvania Germans | 0.0 /100 | #300 | Tragic 13.2% |
| Immigrants | Micronesia | 0.0 /100 | #301 | Tragic 13.2% |
| Arapaho | 0.0 /100 | #302 | Tragic 13.2% |
| Scotch-Irish | 0.0 /100 | #303 | Tragic 13.3% |
| Yakama | 0.0 /100 | #304 | Tragic 13.4% |
| French Canadians | 0.0 /100 | #305 | Tragic 13.4% |
| Cape Verdeans | 0.0 /100 | #306 | Tragic 13.5% |
| Shoshone | 0.0 /100 | #307 | Tragic 13.5% |
| French American Indians | 0.0 /100 | #308 | Tragic 13.5% |
| Tlingit-Haida | 0.0 /100 | #309 | Tragic 13.5% |
| Blackfeet | 0.0 /100 | #310 | Tragic 13.6% |
| Delaware | 0.0 /100 | #311 | Tragic 13.6% |
Demographics Similar to Europeans by Disability
In terms of disability, the demographic groups most similar to Europeans are Subsaharan African (12.3%, a difference of 0.0%), Carpatho Rusyn (12.3%, a difference of 0.010%), Guamanian/Chamorro (12.3%, a difference of 0.020%), Indonesian (12.2%, a difference of 0.060%), and Swiss (12.2%, a difference of 0.090%).
| Demographics | Rating | Rank | Disability |
| Basques | 1.5 /100 | #244 | Tragic 12.2% |
| Liberians | 1.5 /100 | #245 | Tragic 12.2% |
| Swiss | 1.5 /100 | #246 | Tragic 12.2% |
| Indonesians | 1.4 /100 | #247 | Tragic 12.2% |
| Guamanians/Chamorros | 1.4 /100 | #248 | Tragic 12.3% |
| Carpatho Rusyns | 1.4 /100 | #249 | Tragic 12.3% |
| Sub-Saharan Africans | 1.4 /100 | #250 | Tragic 12.3% |
| Europeans | 1.4 /100 | #251 | Tragic 12.3% |
| Bermudans | 1.1 /100 | #252 | Tragic 12.3% |
| Belgians | 0.8 /100 | #253 | Tragic 12.3% |
| German Russians | 0.8 /100 | #254 | Tragic 12.3% |
| Slovenes | 0.6 /100 | #255 | Tragic 12.4% |
| Immigrants | Dominica | 0.6 /100 | #256 | Tragic 12.4% |
| Immigrants | Laos | 0.5 /100 | #257 | Tragic 12.4% |
| Slavs | 0.5 /100 | #258 | Tragic 12.4% |