Okinawan vs Immigrants from Mexico Disability
COMPARE
Okinawan
Immigrants from Mexico
Disability
Disability Comparison
Okinawans
Immigrants from Mexico
10.3%
DISABILITY
100.0/ 100
METRIC RATING
15th/ 347
METRIC RANK
11.9%
DISABILITY
23.8/ 100
METRIC RATING
188th/ 347
METRIC RANK
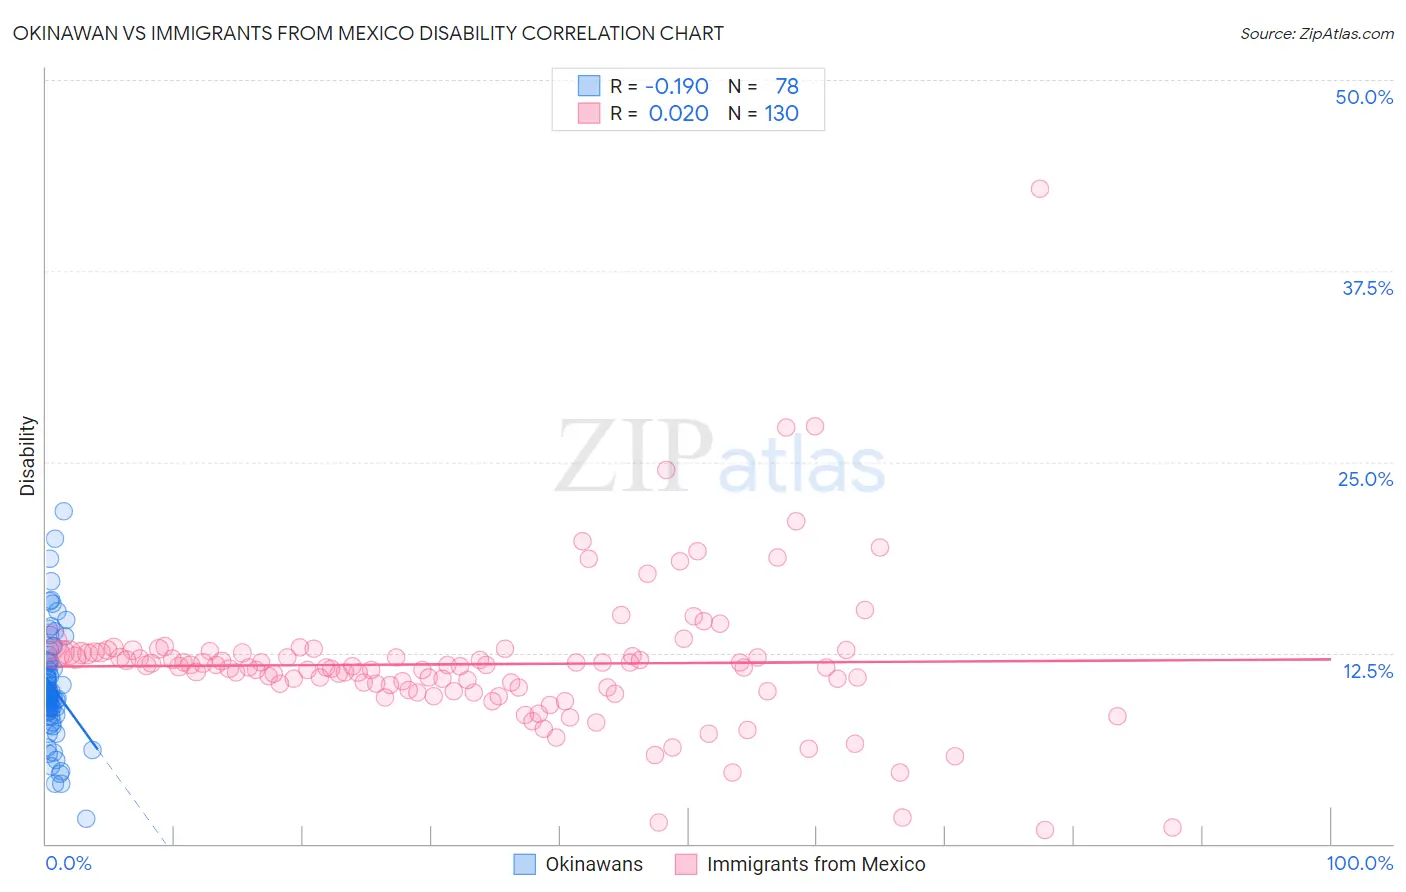
Okinawan vs Immigrants from Mexico Disability Correlation Chart
The statistical analysis conducted on geographies consisting of 73,770,333 people shows a poor negative correlation between the proportion of Okinawans and percentage of population with a disability in the United States with a correlation coefficient (R) of -0.190 and weighted average of 10.3%. Similarly, the statistical analysis conducted on geographies consisting of 513,610,494 people shows no correlation between the proportion of Immigrants from Mexico and percentage of population with a disability in the United States with a correlation coefficient (R) of 0.020 and weighted average of 11.9%, a difference of 15.6%.
Disability Correlation Summary
| Measurement | Okinawan | Immigrants from Mexico |
| Minimum | 1.6% | 0.89% |
| Maximum | 21.8% | 42.9% |
| Range | 20.2% | 42.0% |
| Mean | 10.3% | 11.8% |
| Median | 9.6% | 11.6% |
| Interquartile 25% (IQ1) | 8.6% | 10.1% |
| Interquartile 75% (IQ3) | 11.9% | 12.5% |
| Interquartile Range (IQR) | 3.3% | 2.4% |
| Standard Deviation (Sample) | 3.6% | 4.9% |
| Standard Deviation (Population) | 3.6% | 4.8% |
Similar Demographics by Disability
Demographics Similar to Okinawans by Disability
In terms of disability, the demographic groups most similar to Okinawans are Indian (Asian) (10.3%, a difference of 0.070%), Immigrants from Iran (10.3%, a difference of 0.13%), Immigrants from Korea (10.2%, a difference of 0.31%), Immigrants from Eastern Asia (10.2%, a difference of 0.91%), and Immigrants from Israel (10.1%, a difference of 1.1%).
| Demographics | Rating | Rank | Disability |
| Bolivians | 100.0 /100 | #8 | Exceptional 10.0% |
| Immigrants | Hong Kong | 100.0 /100 | #9 | Exceptional 10.0% |
| Immigrants | China | 100.0 /100 | #10 | Exceptional 10.1% |
| Iranians | 100.0 /100 | #11 | Exceptional 10.1% |
| Immigrants | Israel | 100.0 /100 | #12 | Exceptional 10.1% |
| Immigrants | Eastern Asia | 100.0 /100 | #13 | Exceptional 10.2% |
| Immigrants | Korea | 100.0 /100 | #14 | Exceptional 10.2% |
| Okinawans | 100.0 /100 | #15 | Exceptional 10.3% |
| Indians (Asian) | 100.0 /100 | #16 | Exceptional 10.3% |
| Immigrants | Iran | 100.0 /100 | #17 | Exceptional 10.3% |
| Burmese | 100.0 /100 | #18 | Exceptional 10.4% |
| Immigrants | Pakistan | 100.0 /100 | #19 | Exceptional 10.4% |
| Immigrants | Venezuela | 100.0 /100 | #20 | Exceptional 10.4% |
| Asians | 100.0 /100 | #21 | Exceptional 10.4% |
| Immigrants | Sri Lanka | 100.0 /100 | #22 | Exceptional 10.5% |
Demographics Similar to Immigrants from Mexico by Disability
In terms of disability, the demographic groups most similar to Immigrants from Mexico are Immigrants from Zaire (11.9%, a difference of 0.12%), Immigrants from West Indies (11.9%, a difference of 0.17%), Lebanese (11.8%, a difference of 0.24%), Immigrants from Scotland (11.8%, a difference of 0.26%), and Immigrants from Burma/Myanmar (11.8%, a difference of 0.27%).
| Demographics | Rating | Rank | Disability |
| Immigrants | Oceania | 34.3 /100 | #181 | Fair 11.8% |
| Icelanders | 34.0 /100 | #182 | Fair 11.8% |
| Hondurans | 31.2 /100 | #183 | Fair 11.8% |
| Iraqis | 30.0 /100 | #184 | Fair 11.8% |
| Immigrants | Burma/Myanmar | 28.5 /100 | #185 | Fair 11.8% |
| Immigrants | Scotland | 28.2 /100 | #186 | Fair 11.8% |
| Lebanese | 27.9 /100 | #187 | Fair 11.8% |
| Immigrants | Mexico | 23.8 /100 | #188 | Fair 11.9% |
| Immigrants | Zaire | 21.8 /100 | #189 | Fair 11.9% |
| Immigrants | West Indies | 21.1 /100 | #190 | Fair 11.9% |
| Ute | 19.5 /100 | #191 | Poor 11.9% |
| Lithuanians | 18.8 /100 | #192 | Poor 11.9% |
| Immigrants | Bosnia and Herzegovina | 18.0 /100 | #193 | Poor 11.9% |
| Somalis | 17.3 /100 | #194 | Poor 11.9% |
| Barbadians | 15.8 /100 | #195 | Poor 11.9% |