Yakama vs Black/African American Disability
COMPARE
Yakama
Black/African American
Disability
Disability Comparison
Yakama
Blacks/African Americans
13.4%
DISABILITY
0.0/ 100
METRIC RATING
304th/ 347
METRIC RANK
13.7%
DISABILITY
0.0/ 100
METRIC RATING
314th/ 347
METRIC RANK
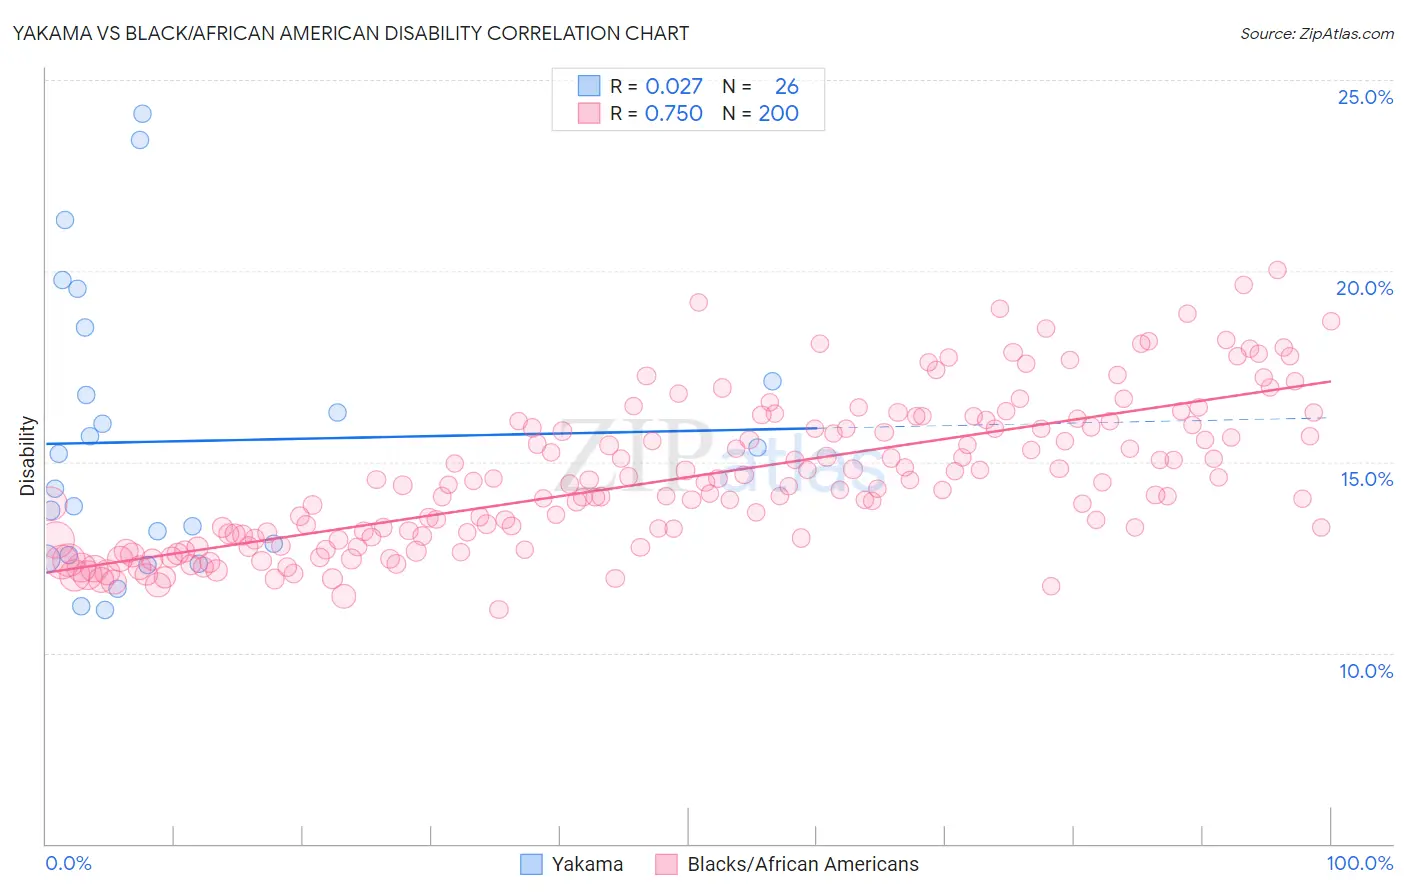
Yakama vs Black/African American Disability Correlation Chart
The statistical analysis conducted on geographies consisting of 19,917,759 people shows no correlation between the proportion of Yakama and percentage of population with a disability in the United States with a correlation coefficient (R) of 0.027 and weighted average of 13.4%. Similarly, the statistical analysis conducted on geographies consisting of 565,891,121 people shows a strong positive correlation between the proportion of Blacks/African Americans and percentage of population with a disability in the United States with a correlation coefficient (R) of 0.750 and weighted average of 13.7%, a difference of 2.4%.
Disability Correlation Summary
| Measurement | Yakama | Black/African American |
| Minimum | 11.1% | 11.1% |
| Maximum | 24.1% | 20.0% |
| Range | 13.0% | 8.9% |
| Mean | 15.5% | 14.6% |
| Median | 14.7% | 14.4% |
| Interquartile 25% (IQ1) | 12.6% | 13.0% |
| Interquartile 75% (IQ3) | 17.1% | 15.9% |
| Interquartile Range (IQR) | 4.5% | 2.9% |
| Standard Deviation (Sample) | 3.7% | 1.9% |
| Standard Deviation (Population) | 3.6% | 1.9% |
Demographics Similar to Yakama and Blacks/African Americans by Disability
In terms of disability, the demographic groups most similar to Yakama are French Canadian (13.4%, a difference of 0.35%), Scotch-Irish (13.3%, a difference of 0.47%), Cape Verdean (13.5%, a difference of 0.95%), Shoshone (13.5%, a difference of 1.0%), and French American Indian (13.5%, a difference of 1.1%). Similarly, the demographic groups most similar to Blacks/African Americans are Puget Sound Salish (13.7%, a difference of 0.0%), Pima (13.7%, a difference of 0.030%), Immigrants from Cabo Verde (13.7%, a difference of 0.030%), Cree (13.7%, a difference of 0.040%), and Spanish American (13.6%, a difference of 0.39%).
| Demographics | Rating | Rank | Disability |
| French | 0.0 /100 | #299 | Tragic 13.2% |
| Pennsylvania Germans | 0.0 /100 | #300 | Tragic 13.2% |
| Immigrants | Micronesia | 0.0 /100 | #301 | Tragic 13.2% |
| Arapaho | 0.0 /100 | #302 | Tragic 13.2% |
| Scotch-Irish | 0.0 /100 | #303 | Tragic 13.3% |
| Yakama | 0.0 /100 | #304 | Tragic 13.4% |
| French Canadians | 0.0 /100 | #305 | Tragic 13.4% |
| Cape Verdeans | 0.0 /100 | #306 | Tragic 13.5% |
| Shoshone | 0.0 /100 | #307 | Tragic 13.5% |
| French American Indians | 0.0 /100 | #308 | Tragic 13.5% |
| Tlingit-Haida | 0.0 /100 | #309 | Tragic 13.5% |
| Blackfeet | 0.0 /100 | #310 | Tragic 13.6% |
| Delaware | 0.0 /100 | #311 | Tragic 13.6% |
| Spanish Americans | 0.0 /100 | #312 | Tragic 13.6% |
| Cree | 0.0 /100 | #313 | Tragic 13.7% |
| Blacks/African Americans | 0.0 /100 | #314 | Tragic 13.7% |
| Puget Sound Salish | 0.0 /100 | #315 | Tragic 13.7% |
| Pima | 0.0 /100 | #316 | Tragic 13.7% |
| Immigrants | Cabo Verde | 0.0 /100 | #317 | Tragic 13.7% |
| Menominee | 0.0 /100 | #318 | Tragic 13.8% |
| Iroquois | 0.0 /100 | #319 | Tragic 13.8% |