Immigrants from Kenya vs Immigrants from Mexico Disability
COMPARE
Immigrants from Kenya
Immigrants from Mexico
Disability
Disability Comparison
Immigrants from Kenya
Immigrants from Mexico
11.6%
DISABILITY
72.1/ 100
METRIC RATING
151st/ 347
METRIC RANK
11.9%
DISABILITY
23.8/ 100
METRIC RATING
188th/ 347
METRIC RANK
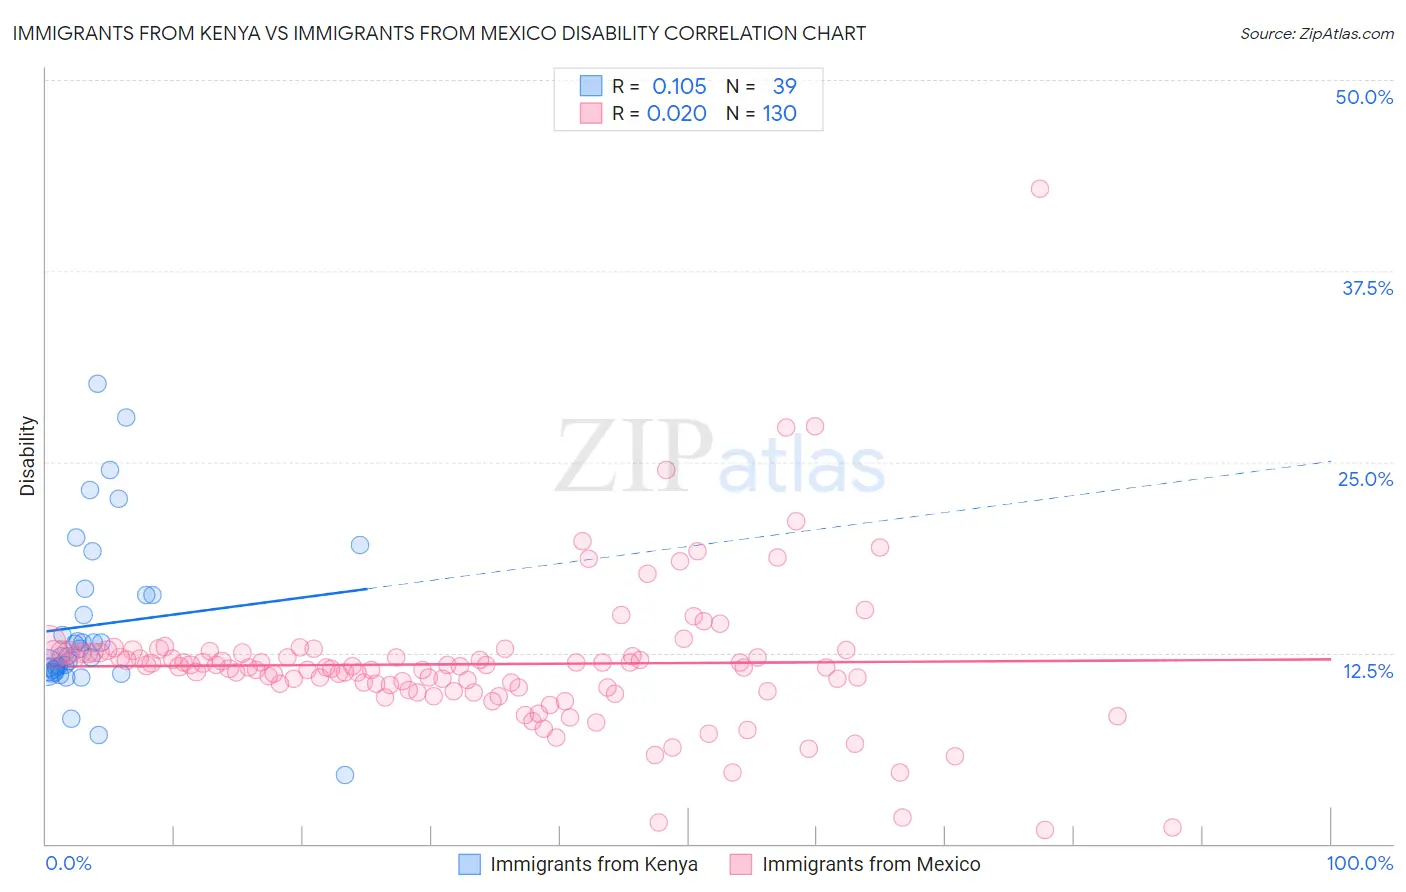
Immigrants from Kenya vs Immigrants from Mexico Disability Correlation Chart
The statistical analysis conducted on geographies consisting of 218,058,395 people shows a poor positive correlation between the proportion of Immigrants from Kenya and percentage of population with a disability in the United States with a correlation coefficient (R) of 0.105 and weighted average of 11.6%. Similarly, the statistical analysis conducted on geographies consisting of 513,610,494 people shows no correlation between the proportion of Immigrants from Mexico and percentage of population with a disability in the United States with a correlation coefficient (R) of 0.020 and weighted average of 11.9%, a difference of 2.4%.
Disability Correlation Summary
| Measurement | Immigrants from Kenya | Immigrants from Mexico |
| Minimum | 4.5% | 0.89% |
| Maximum | 30.1% | 42.9% |
| Range | 25.6% | 42.0% |
| Mean | 14.3% | 11.8% |
| Median | 12.3% | 11.6% |
| Interquartile 25% (IQ1) | 11.4% | 10.1% |
| Interquartile 75% (IQ3) | 16.3% | 12.5% |
| Interquartile Range (IQR) | 4.9% | 2.4% |
| Standard Deviation (Sample) | 5.4% | 4.9% |
| Standard Deviation (Population) | 5.3% | 4.8% |
Similar Demographics by Disability
Demographics Similar to Immigrants from Kenya by Disability
In terms of disability, the demographic groups most similar to Immigrants from Kenya are Immigrants from Moldova (11.6%, a difference of 0.0%), Romanian (11.6%, a difference of 0.030%), Immigrants from Ghana (11.6%, a difference of 0.050%), Immigrants from Guatemala (11.6%, a difference of 0.050%), and Immigrants from Norway (11.6%, a difference of 0.060%).
| Demographics | Rating | Rank | Disability |
| Australians | 82.5 /100 | #144 | Excellent 11.5% |
| Nigerians | 81.3 /100 | #145 | Excellent 11.5% |
| Immigrants | Hungary | 79.0 /100 | #146 | Good 11.5% |
| Immigrants | Ukraine | 77.6 /100 | #147 | Good 11.5% |
| Sudanese | 77.1 /100 | #148 | Good 11.5% |
| Immigrants | Norway | 73.2 /100 | #149 | Good 11.6% |
| Romanians | 72.7 /100 | #150 | Good 11.6% |
| Immigrants | Kenya | 72.1 /100 | #151 | Good 11.6% |
| Immigrants | Moldova | 72.0 /100 | #152 | Good 11.6% |
| Immigrants | Ghana | 71.2 /100 | #153 | Good 11.6% |
| Immigrants | Guatemala | 71.1 /100 | #154 | Good 11.6% |
| Immigrants | Netherlands | 69.8 /100 | #155 | Good 11.6% |
| Immigrants | Fiji | 69.5 /100 | #156 | Good 11.6% |
| Immigrants | Middle Africa | 69.5 /100 | #157 | Good 11.6% |
| Armenians | 65.9 /100 | #158 | Good 11.6% |
Demographics Similar to Immigrants from Mexico by Disability
In terms of disability, the demographic groups most similar to Immigrants from Mexico are Immigrants from Zaire (11.9%, a difference of 0.12%), Immigrants from West Indies (11.9%, a difference of 0.17%), Lebanese (11.8%, a difference of 0.24%), Immigrants from Scotland (11.8%, a difference of 0.26%), and Immigrants from Burma/Myanmar (11.8%, a difference of 0.27%).
| Demographics | Rating | Rank | Disability |
| Immigrants | Oceania | 34.3 /100 | #181 | Fair 11.8% |
| Icelanders | 34.0 /100 | #182 | Fair 11.8% |
| Hondurans | 31.2 /100 | #183 | Fair 11.8% |
| Iraqis | 30.0 /100 | #184 | Fair 11.8% |
| Immigrants | Burma/Myanmar | 28.5 /100 | #185 | Fair 11.8% |
| Immigrants | Scotland | 28.2 /100 | #186 | Fair 11.8% |
| Lebanese | 27.9 /100 | #187 | Fair 11.8% |
| Immigrants | Mexico | 23.8 /100 | #188 | Fair 11.9% |
| Immigrants | Zaire | 21.8 /100 | #189 | Fair 11.9% |
| Immigrants | West Indies | 21.1 /100 | #190 | Fair 11.9% |
| Ute | 19.5 /100 | #191 | Poor 11.9% |
| Lithuanians | 18.8 /100 | #192 | Poor 11.9% |
| Immigrants | Bosnia and Herzegovina | 18.0 /100 | #193 | Poor 11.9% |
| Somalis | 17.3 /100 | #194 | Poor 11.9% |
| Barbadians | 15.8 /100 | #195 | Poor 11.9% |