Immigrants from Australia vs Thai Self-Care Disability
COMPARE
Immigrants from Australia
Thai
Self-Care Disability
Self-Care Disability Comparison
Immigrants from Australia
Thais
2.3%
SELF-CARE DISABILITY
99.9/ 100
METRIC RATING
35th/ 347
METRIC RANK
2.1%
SELF-CARE DISABILITY
100.0/ 100
METRIC RATING
3rd/ 347
METRIC RANK
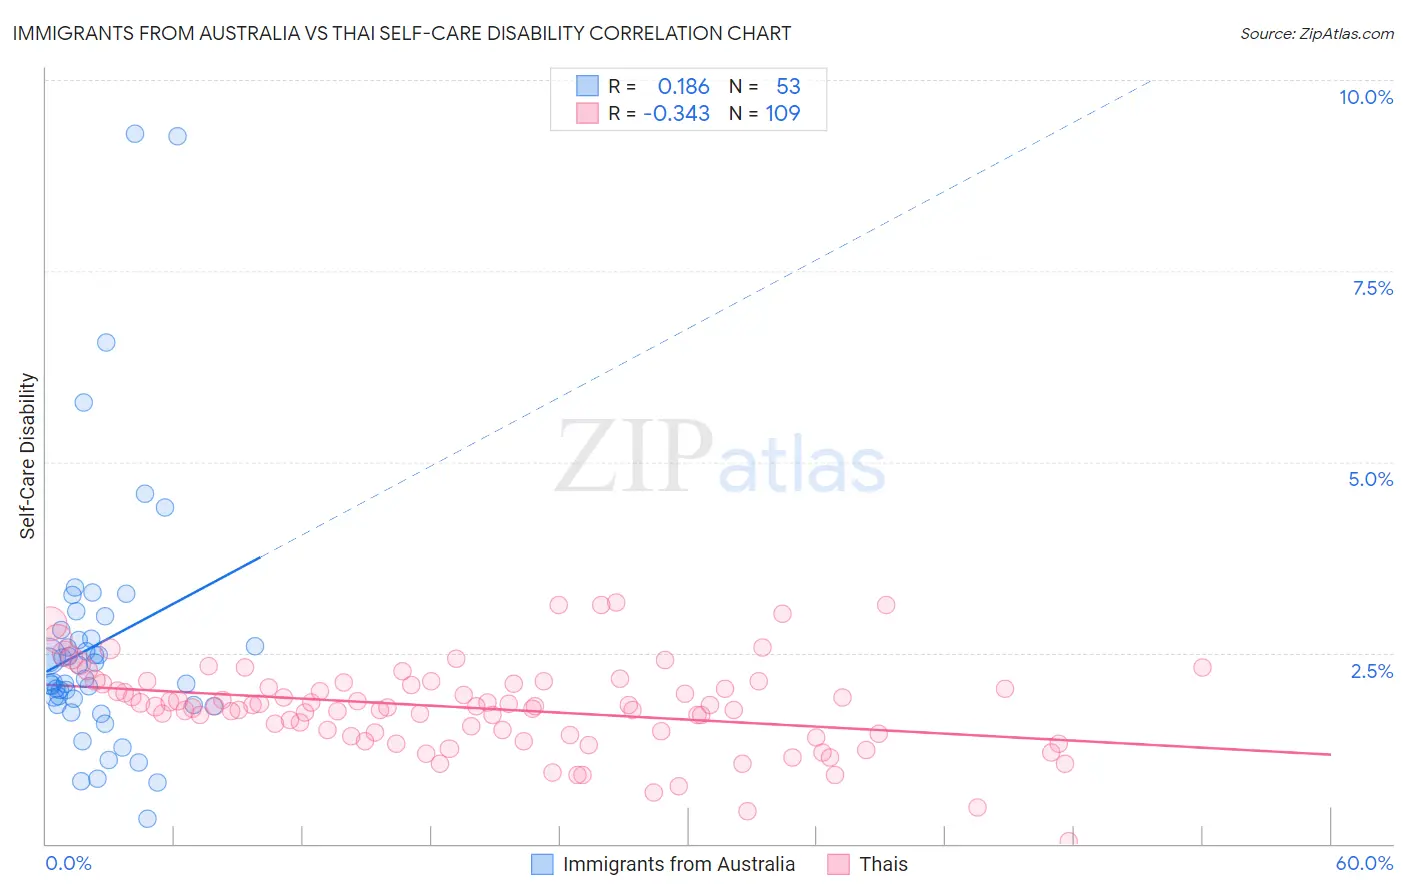
Immigrants from Australia vs Thai Self-Care Disability Correlation Chart
The statistical analysis conducted on geographies consisting of 227,025,526 people shows a poor positive correlation between the proportion of Immigrants from Australia and percentage of population with self-care disability in the United States with a correlation coefficient (R) of 0.186 and weighted average of 2.3%. Similarly, the statistical analysis conducted on geographies consisting of 474,998,821 people shows a mild negative correlation between the proportion of Thais and percentage of population with self-care disability in the United States with a correlation coefficient (R) of -0.343 and weighted average of 2.1%, a difference of 8.9%.
Self-Care Disability Correlation Summary
| Measurement | Immigrants from Australia | Thai |
| Minimum | 0.32% | 0.030% |
| Maximum | 9.3% | 3.2% |
| Range | 9.0% | 3.1% |
| Mean | 2.6% | 1.8% |
| Median | 2.2% | 1.8% |
| Interquartile 25% (IQ1) | 1.8% | 1.4% |
| Interquartile 75% (IQ3) | 2.7% | 2.1% |
| Interquartile Range (IQR) | 0.93% | 0.67% |
| Standard Deviation (Sample) | 1.7% | 0.57% |
| Standard Deviation (Population) | 1.7% | 0.57% |
Similar Demographics by Self-Care Disability
Demographics Similar to Immigrants from Australia by Self-Care Disability
In terms of self-care disability, the demographic groups most similar to Immigrants from Australia are Immigrants from Lithuania (2.3%, a difference of 0.010%), Immigrants from Turkey (2.3%, a difference of 0.060%), Immigrants from Korea (2.3%, a difference of 0.12%), Immigrants from Sweden (2.3%, a difference of 0.18%), and Immigrants from Eastern Africa (2.3%, a difference of 0.31%).
| Demographics | Rating | Rank | Self-Care Disability |
| Inupiat | 99.9 /100 | #28 | Exceptional 2.2% |
| Immigrants | Zimbabwe | 99.9 /100 | #29 | Exceptional 2.3% |
| Paraguayans | 99.9 /100 | #30 | Exceptional 2.3% |
| Danes | 99.9 /100 | #31 | Exceptional 2.3% |
| Burmese | 99.9 /100 | #32 | Exceptional 2.3% |
| Immigrants | Korea | 99.9 /100 | #33 | Exceptional 2.3% |
| Immigrants | Turkey | 99.9 /100 | #34 | Exceptional 2.3% |
| Immigrants | Australia | 99.9 /100 | #35 | Exceptional 2.3% |
| Immigrants | Lithuania | 99.9 /100 | #36 | Exceptional 2.3% |
| Immigrants | Sweden | 99.9 /100 | #37 | Exceptional 2.3% |
| Immigrants | Eastern Africa | 99.9 /100 | #38 | Exceptional 2.3% |
| Immigrants | Bulgaria | 99.8 /100 | #39 | Exceptional 2.3% |
| Iranians | 99.8 /100 | #40 | Exceptional 2.3% |
| Immigrants | Sudan | 99.8 /100 | #41 | Exceptional 2.3% |
| Immigrants | Uganda | 99.8 /100 | #42 | Exceptional 2.3% |
Demographics Similar to Thais by Self-Care Disability
In terms of self-care disability, the demographic groups most similar to Thais are Immigrants from Singapore (2.1%, a difference of 2.3%), Immigrants from India (2.0%, a difference of 3.0%), Zimbabwean (2.2%, a difference of 3.3%), Filipino (2.2%, a difference of 3.6%), and Immigrants from Bolivia (2.2%, a difference of 3.8%).
| Demographics | Rating | Rank | Self-Care Disability |
| Yup'ik | 100.0 /100 | #1 | Exceptional 1.9% |
| Immigrants | India | 100.0 /100 | #2 | Exceptional 2.0% |
| Thais | 100.0 /100 | #3 | Exceptional 2.1% |
| Immigrants | Singapore | 100.0 /100 | #4 | Exceptional 2.1% |
| Zimbabweans | 100.0 /100 | #5 | Exceptional 2.2% |
| Filipinos | 100.0 /100 | #6 | Exceptional 2.2% |
| Immigrants | Bolivia | 100.0 /100 | #7 | Exceptional 2.2% |
| Bolivians | 100.0 /100 | #8 | Exceptional 2.2% |
| Immigrants | Nepal | 100.0 /100 | #9 | Exceptional 2.2% |
| Sudanese | 100.0 /100 | #10 | Exceptional 2.2% |
| Immigrants | South Central Asia | 100.0 /100 | #11 | Exceptional 2.2% |
| Immigrants | Ethiopia | 100.0 /100 | #12 | Exceptional 2.2% |
| Ethiopians | 100.0 /100 | #13 | Exceptional 2.2% |
| Luxembourgers | 100.0 /100 | #14 | Exceptional 2.2% |
| Okinawans | 100.0 /100 | #15 | Exceptional 2.2% |