Immigrants from Eritrea vs Jordanian Hearing Disability
COMPARE
Immigrants from Eritrea
Jordanian
Hearing Disability
Hearing Disability Comparison
Immigrants from Eritrea
Jordanians
2.7%
HEARING DISABILITY
98.5/ 100
METRIC RATING
59th/ 347
METRIC RANK
2.8%
HEARING DISABILITY
89.5/ 100
METRIC RATING
120th/ 347
METRIC RANK
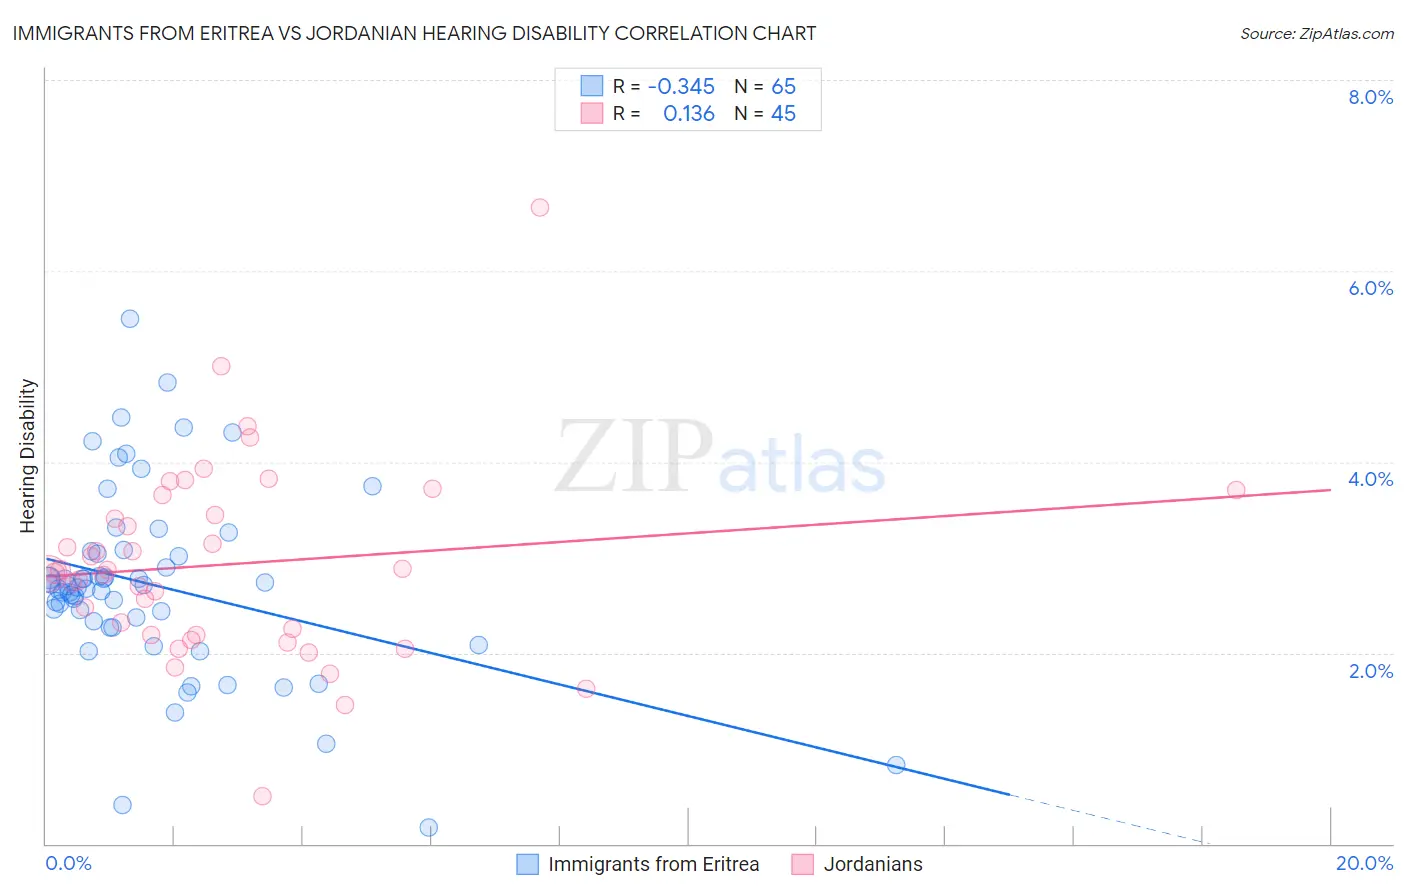
Immigrants from Eritrea vs Jordanian Hearing Disability Correlation Chart
The statistical analysis conducted on geographies consisting of 104,850,181 people shows a mild negative correlation between the proportion of Immigrants from Eritrea and percentage of population with hearing disability in the United States with a correlation coefficient (R) of -0.345 and weighted average of 2.7%. Similarly, the statistical analysis conducted on geographies consisting of 166,401,829 people shows a poor positive correlation between the proportion of Jordanians and percentage of population with hearing disability in the United States with a correlation coefficient (R) of 0.136 and weighted average of 2.8%, a difference of 5.4%.
Hearing Disability Correlation Summary
| Measurement | Immigrants from Eritrea | Jordanian |
| Minimum | 0.17% | 0.50% |
| Maximum | 5.5% | 6.7% |
| Range | 5.3% | 6.2% |
| Mean | 2.7% | 2.9% |
| Median | 2.7% | 2.8% |
| Interquartile 25% (IQ1) | 2.3% | 2.2% |
| Interquartile 75% (IQ3) | 3.0% | 3.5% |
| Interquartile Range (IQR) | 0.75% | 1.4% |
| Standard Deviation (Sample) | 0.97% | 1.0% |
| Standard Deviation (Population) | 0.96% | 1.0% |
Similar Demographics by Hearing Disability
Demographics Similar to Immigrants from Eritrea by Hearing Disability
In terms of hearing disability, the demographic groups most similar to Immigrants from Eritrea are Immigrants from Egypt (2.7%, a difference of 0.070%), Immigrants from Peru (2.7%, a difference of 0.11%), Immigrants from Uzbekistan (2.7%, a difference of 0.20%), Immigrants from Colombia (2.7%, a difference of 0.21%), and Indian (Asian) (2.7%, a difference of 0.26%).
| Demographics | Rating | Rank | Hearing Disability |
| Jamaicans | 99.0 /100 | #52 | Exceptional 2.7% |
| Immigrants | Eastern Asia | 99.0 /100 | #53 | Exceptional 2.7% |
| Ethiopians | 99.0 /100 | #54 | Exceptional 2.7% |
| Immigrants | Ethiopia | 99.0 /100 | #55 | Exceptional 2.7% |
| Immigrants | Nicaragua | 99.0 /100 | #56 | Exceptional 2.7% |
| South Americans | 99.0 /100 | #57 | Exceptional 2.7% |
| Immigrants | Peru | 98.6 /100 | #58 | Exceptional 2.7% |
| Immigrants | Eritrea | 98.5 /100 | #59 | Exceptional 2.7% |
| Immigrants | Egypt | 98.5 /100 | #60 | Exceptional 2.7% |
| Immigrants | Uzbekistan | 98.4 /100 | #61 | Exceptional 2.7% |
| Immigrants | Colombia | 98.4 /100 | #62 | Exceptional 2.7% |
| Indians (Asian) | 98.4 /100 | #63 | Exceptional 2.7% |
| Immigrants | Sri Lanka | 98.4 /100 | #64 | Exceptional 2.7% |
| Immigrants | Nepal | 98.3 /100 | #65 | Exceptional 2.7% |
| Immigrants | Belize | 98.2 /100 | #66 | Exceptional 2.7% |
Demographics Similar to Jordanians by Hearing Disability
In terms of hearing disability, the demographic groups most similar to Jordanians are Cuban (2.8%, a difference of 0.030%), Kenyan (2.8%, a difference of 0.090%), Zimbabwean (2.8%, a difference of 0.11%), Immigrants from Liberia (2.8%, a difference of 0.13%), and Liberian (2.8%, a difference of 0.13%).
| Demographics | Rating | Rank | Hearing Disability |
| Immigrants | Belarus | 91.6 /100 | #113 | Exceptional 2.8% |
| Cambodians | 91.1 /100 | #114 | Exceptional 2.8% |
| Immigrants | Latin America | 90.5 /100 | #115 | Exceptional 2.8% |
| Immigrants | Immigrants | 90.3 /100 | #116 | Exceptional 2.8% |
| Immigrants | Liberia | 90.0 /100 | #117 | Excellent 2.8% |
| Zimbabweans | 89.9 /100 | #118 | Excellent 2.8% |
| Kenyans | 89.8 /100 | #119 | Excellent 2.8% |
| Jordanians | 89.5 /100 | #120 | Excellent 2.8% |
| Cubans | 89.4 /100 | #121 | Excellent 2.8% |
| Liberians | 89.0 /100 | #122 | Excellent 2.8% |
| Immigrants | Zaire | 88.6 /100 | #123 | Excellent 2.9% |
| Bahamians | 88.6 /100 | #124 | Excellent 2.9% |
| Immigrants | Albania | 88.5 /100 | #125 | Excellent 2.9% |
| Immigrants | Sudan | 87.8 /100 | #126 | Excellent 2.9% |
| South American Indians | 86.9 /100 | #127 | Excellent 2.9% |