Welsh vs Immigrants from Belgium Hearing Disability
COMPARE
Welsh
Immigrants from Belgium
Hearing Disability
Hearing Disability Comparison
Welsh
Immigrants from Belgium
3.7%
HEARING DISABILITY
0.0/ 100
METRIC RATING
295th/ 347
METRIC RANK
3.0%
HEARING DISABILITY
41.5/ 100
METRIC RATING
181st/ 347
METRIC RANK
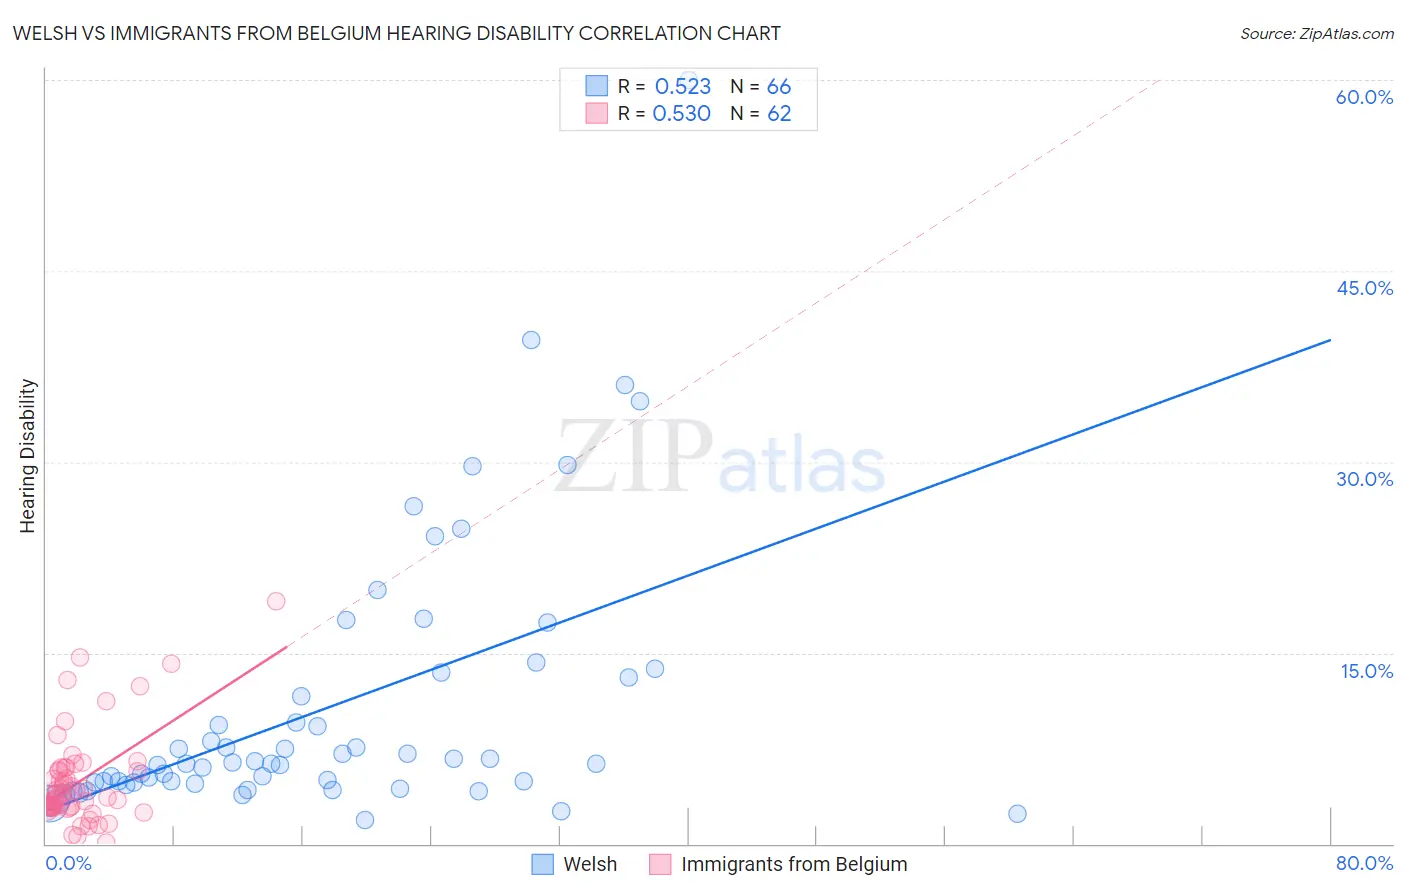
Welsh vs Immigrants from Belgium Hearing Disability Correlation Chart
The statistical analysis conducted on geographies consisting of 528,244,925 people shows a substantial positive correlation between the proportion of Welsh and percentage of population with hearing disability in the United States with a correlation coefficient (R) of 0.523 and weighted average of 3.7%. Similarly, the statistical analysis conducted on geographies consisting of 146,709,031 people shows a substantial positive correlation between the proportion of Immigrants from Belgium and percentage of population with hearing disability in the United States with a correlation coefficient (R) of 0.530 and weighted average of 3.0%, a difference of 22.8%.
Hearing Disability Correlation Summary
| Measurement | Welsh | Immigrants from Belgium |
| Minimum | 1.9% | 0.12% |
| Maximum | 60.0% | 19.0% |
| Range | 58.1% | 18.9% |
| Mean | 10.7% | 4.8% |
| Median | 6.3% | 3.6% |
| Interquartile 25% (IQ1) | 4.8% | 2.9% |
| Interquartile 75% (IQ3) | 13.0% | 5.8% |
| Interquartile Range (IQR) | 8.2% | 2.9% |
| Standard Deviation (Sample) | 10.8% | 3.6% |
| Standard Deviation (Population) | 10.7% | 3.6% |
Similar Demographics by Hearing Disability
Demographics Similar to Welsh by Hearing Disability
In terms of hearing disability, the demographic groups most similar to Welsh are Pima (3.7%, a difference of 0.13%), Immigrants from the Azores (3.7%, a difference of 0.20%), Iroquois (3.7%, a difference of 0.27%), Celtic (3.7%, a difference of 0.39%), and Norwegian (3.7%, a difference of 0.51%).
| Demographics | Rating | Rank | Hearing Disability |
| Irish | 0.0 /100 | #288 | Tragic 3.7% |
| Chinese | 0.0 /100 | #289 | Tragic 3.7% |
| Whites/Caucasians | 0.0 /100 | #290 | Tragic 3.7% |
| Finns | 0.0 /100 | #291 | Tragic 3.7% |
| Native Hawaiians | 0.0 /100 | #292 | Tragic 3.7% |
| Norwegians | 0.0 /100 | #293 | Tragic 3.7% |
| Iroquois | 0.0 /100 | #294 | Tragic 3.7% |
| Welsh | 0.0 /100 | #295 | Tragic 3.7% |
| Pima | 0.0 /100 | #296 | Tragic 3.7% |
| Immigrants | Azores | 0.0 /100 | #297 | Tragic 3.7% |
| Celtics | 0.0 /100 | #298 | Tragic 3.7% |
| Germans | 0.0 /100 | #299 | Tragic 3.7% |
| Scottish | 0.0 /100 | #300 | Tragic 3.7% |
| Pennsylvania Germans | 0.0 /100 | #301 | Tragic 3.7% |
| Dutch | 0.0 /100 | #302 | Tragic 3.7% |
Demographics Similar to Immigrants from Belgium by Hearing Disability
In terms of hearing disability, the demographic groups most similar to Immigrants from Belgium are Immigrants from Italy (3.0%, a difference of 0.030%), Immigrants from Sweden (3.0%, a difference of 0.090%), Immigrants from Moldova (3.0%, a difference of 0.15%), Bulgarian (3.0%, a difference of 0.17%), and Immigrants from Ireland (3.0%, a difference of 0.40%).
| Demographics | Rating | Rank | Hearing Disability |
| Indonesians | 50.0 /100 | #174 | Average 3.0% |
| Immigrants | Romania | 48.4 /100 | #175 | Average 3.0% |
| Panamanians | 47.0 /100 | #176 | Average 3.0% |
| Immigrants | Philippines | 46.4 /100 | #177 | Average 3.0% |
| Japanese | 46.0 /100 | #178 | Average 3.0% |
| Immigrants | Moldova | 43.1 /100 | #179 | Average 3.0% |
| Immigrants | Sweden | 42.4 /100 | #180 | Average 3.0% |
| Immigrants | Belgium | 41.5 /100 | #181 | Average 3.0% |
| Immigrants | Italy | 41.1 /100 | #182 | Average 3.0% |
| Bulgarians | 39.7 /100 | #183 | Fair 3.0% |
| Immigrants | Ireland | 37.4 /100 | #184 | Fair 3.0% |
| Immigrants | Southern Europe | 35.3 /100 | #185 | Fair 3.0% |
| Immigrants | Mexico | 34.9 /100 | #186 | Fair 3.0% |
| Blacks/African Americans | 34.7 /100 | #187 | Fair 3.0% |
| Mexican American Indians | 34.7 /100 | #188 | Fair 3.0% |