Welsh vs Italian Hearing Disability
COMPARE
Welsh
Italian
Hearing Disability
Hearing Disability Comparison
Welsh
Italians
3.7%
HEARING DISABILITY
0.0/ 100
METRIC RATING
295th/ 347
METRIC RANK
3.4%
HEARING DISABILITY
0.4/ 100
METRIC RATING
249th/ 347
METRIC RANK
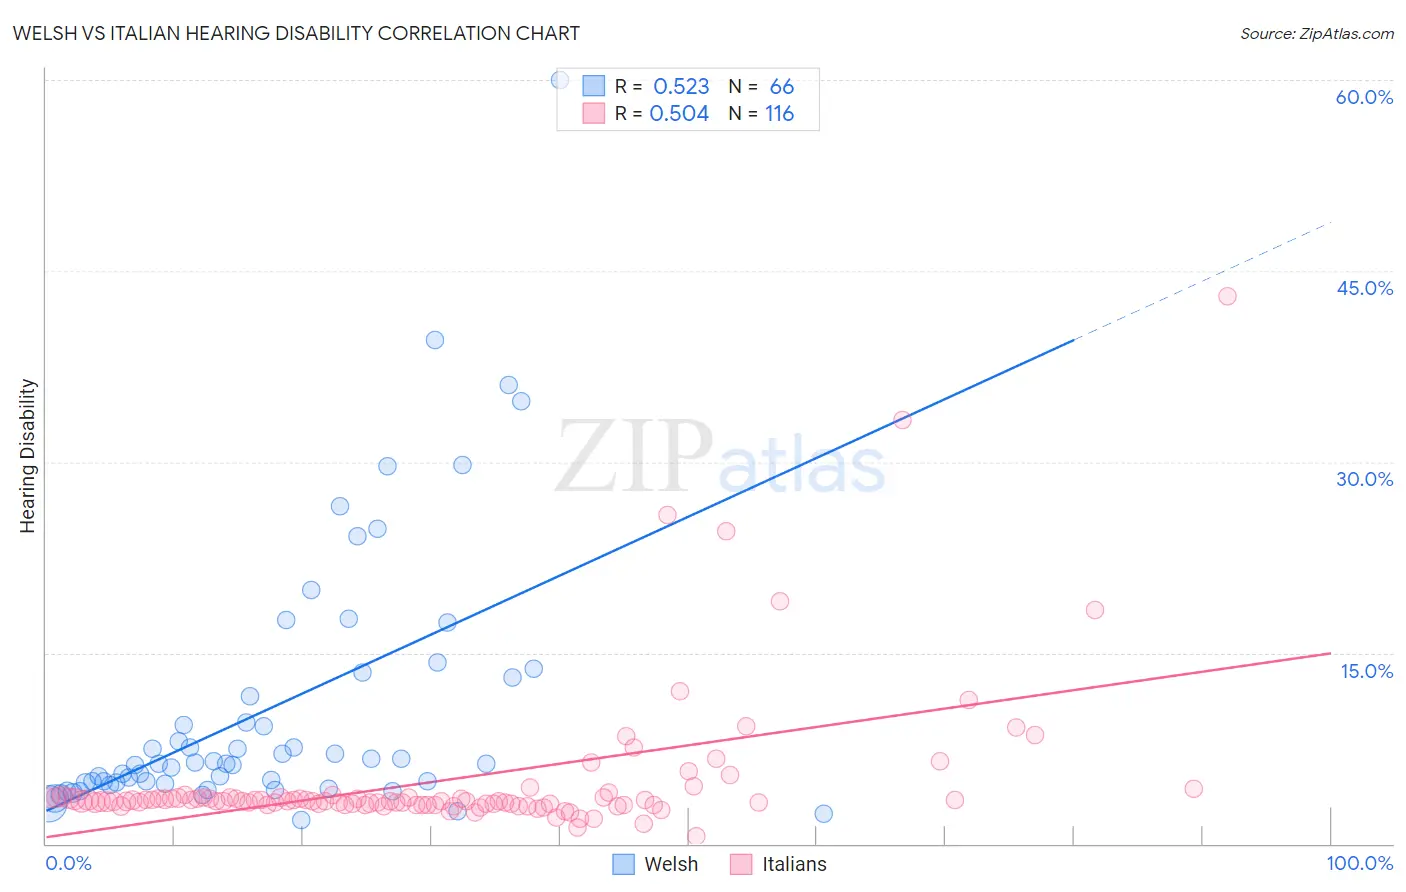
Welsh vs Italian Hearing Disability Correlation Chart
The statistical analysis conducted on geographies consisting of 528,244,925 people shows a substantial positive correlation between the proportion of Welsh and percentage of population with hearing disability in the United States with a correlation coefficient (R) of 0.523 and weighted average of 3.7%. Similarly, the statistical analysis conducted on geographies consisting of 574,261,406 people shows a substantial positive correlation between the proportion of Italians and percentage of population with hearing disability in the United States with a correlation coefficient (R) of 0.504 and weighted average of 3.4%, a difference of 9.8%.
Hearing Disability Correlation Summary
| Measurement | Welsh | Italian |
| Minimum | 1.9% | 0.61% |
| Maximum | 60.0% | 43.0% |
| Range | 58.1% | 42.4% |
| Mean | 10.7% | 5.0% |
| Median | 6.3% | 3.4% |
| Interquartile 25% (IQ1) | 4.8% | 3.1% |
| Interquartile 75% (IQ3) | 13.0% | 3.6% |
| Interquartile Range (IQR) | 8.2% | 0.52% |
| Standard Deviation (Sample) | 10.8% | 5.9% |
| Standard Deviation (Population) | 10.7% | 5.8% |
Similar Demographics by Hearing Disability
Demographics Similar to Welsh by Hearing Disability
In terms of hearing disability, the demographic groups most similar to Welsh are Pima (3.7%, a difference of 0.13%), Immigrants from the Azores (3.7%, a difference of 0.20%), Iroquois (3.7%, a difference of 0.27%), Celtic (3.7%, a difference of 0.39%), and Norwegian (3.7%, a difference of 0.51%).
| Demographics | Rating | Rank | Hearing Disability |
| Irish | 0.0 /100 | #288 | Tragic 3.7% |
| Chinese | 0.0 /100 | #289 | Tragic 3.7% |
| Whites/Caucasians | 0.0 /100 | #290 | Tragic 3.7% |
| Finns | 0.0 /100 | #291 | Tragic 3.7% |
| Native Hawaiians | 0.0 /100 | #292 | Tragic 3.7% |
| Norwegians | 0.0 /100 | #293 | Tragic 3.7% |
| Iroquois | 0.0 /100 | #294 | Tragic 3.7% |
| Welsh | 0.0 /100 | #295 | Tragic 3.7% |
| Pima | 0.0 /100 | #296 | Tragic 3.7% |
| Immigrants | Azores | 0.0 /100 | #297 | Tragic 3.7% |
| Celtics | 0.0 /100 | #298 | Tragic 3.7% |
| Germans | 0.0 /100 | #299 | Tragic 3.7% |
| Scottish | 0.0 /100 | #300 | Tragic 3.7% |
| Pennsylvania Germans | 0.0 /100 | #301 | Tragic 3.7% |
| Dutch | 0.0 /100 | #302 | Tragic 3.7% |
Demographics Similar to Italians by Hearing Disability
In terms of hearing disability, the demographic groups most similar to Italians are Yuman (3.4%, a difference of 0.010%), Hungarian (3.4%, a difference of 0.24%), Croatian (3.4%, a difference of 0.45%), Austrian (3.4%, a difference of 0.53%), and Lithuanian (3.4%, a difference of 0.75%).
| Demographics | Rating | Rank | Hearing Disability |
| Yugoslavians | 1.0 /100 | #242 | Tragic 3.3% |
| Immigrants | Western Europe | 1.0 /100 | #243 | Tragic 3.3% |
| Assyrians/Chaldeans/Syriacs | 0.9 /100 | #244 | Tragic 3.3% |
| Immigrants | Scotland | 0.8 /100 | #245 | Tragic 3.3% |
| Immigrants | England | 0.7 /100 | #246 | Tragic 3.3% |
| Lithuanians | 0.6 /100 | #247 | Tragic 3.4% |
| Austrians | 0.6 /100 | #248 | Tragic 3.4% |
| Italians | 0.4 /100 | #249 | Tragic 3.4% |
| Yuman | 0.4 /100 | #250 | Tragic 3.4% |
| Hungarians | 0.4 /100 | #251 | Tragic 3.4% |
| Croatians | 0.4 /100 | #252 | Tragic 3.4% |
| Carpatho Rusyns | 0.3 /100 | #253 | Tragic 3.4% |
| Slavs | 0.2 /100 | #254 | Tragic 3.4% |
| Poles | 0.2 /100 | #255 | Tragic 3.4% |
| Hmong | 0.2 /100 | #256 | Tragic 3.4% |