Welsh vs Alsatian High School Diploma
COMPARE
Welsh
Alsatian
High School Diploma
High School Diploma Comparison
Welsh
Alsatians
91.2%
HIGH SCHOOL DIPLOMA
99.8/ 100
METRIC RATING
50th/ 347
METRIC RANK
89.4%
HIGH SCHOOL DIPLOMA
66.8/ 100
METRIC RATING
154th/ 347
METRIC RANK
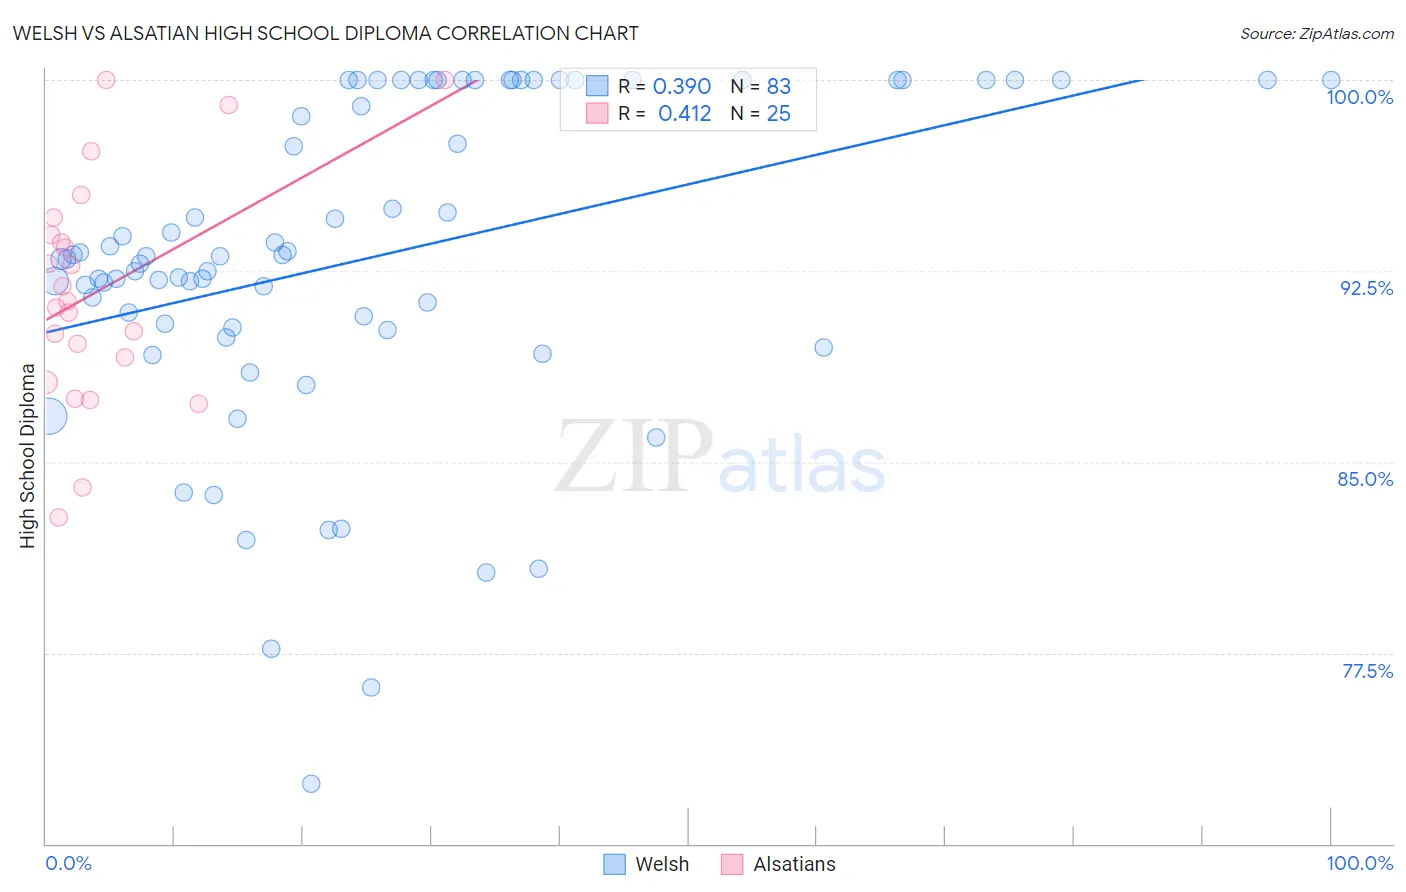
Welsh vs Alsatian High School Diploma Correlation Chart
The statistical analysis conducted on geographies consisting of 528,596,196 people shows a mild positive correlation between the proportion of Welsh and percentage of population with at least high school diploma education in the United States with a correlation coefficient (R) of 0.390 and weighted average of 91.2%. Similarly, the statistical analysis conducted on geographies consisting of 82,682,365 people shows a moderate positive correlation between the proportion of Alsatians and percentage of population with at least high school diploma education in the United States with a correlation coefficient (R) of 0.412 and weighted average of 89.4%, a difference of 2.0%.
High School Diploma Correlation Summary
| Measurement | Welsh | Alsatian |
| Minimum | 72.4% | 82.8% |
| Maximum | 100.0% | 100.0% |
| Range | 27.6% | 17.2% |
| Mean | 93.0% | 91.8% |
| Median | 93.1% | 91.3% |
| Interquartile 25% (IQ1) | 90.3% | 88.6% |
| Interquartile 75% (IQ3) | 100.0% | 94.3% |
| Interquartile Range (IQR) | 9.7% | 5.7% |
| Standard Deviation (Sample) | 6.4% | 4.5% |
| Standard Deviation (Population) | 6.3% | 4.4% |
Similar Demographics by High School Diploma
Demographics Similar to Welsh by High School Diploma
In terms of high school diploma, the demographic groups most similar to Welsh are Bhutanese (91.2%, a difference of 0.020%), Australian (91.2%, a difference of 0.030%), Belgian (91.2%, a difference of 0.030%), Greek (91.2%, a difference of 0.040%), and New Zealander (91.1%, a difference of 0.050%).
| Demographics | Rating | Rank | High School Diploma |
| British | 99.8 /100 | #43 | Exceptional 91.3% |
| Immigrants | Austria | 99.8 /100 | #44 | Exceptional 91.3% |
| Turks | 99.8 /100 | #45 | Exceptional 91.2% |
| Greeks | 99.8 /100 | #46 | Exceptional 91.2% |
| Australians | 99.8 /100 | #47 | Exceptional 91.2% |
| Belgians | 99.8 /100 | #48 | Exceptional 91.2% |
| Bhutanese | 99.8 /100 | #49 | Exceptional 91.2% |
| Welsh | 99.8 /100 | #50 | Exceptional 91.2% |
| New Zealanders | 99.7 /100 | #51 | Exceptional 91.1% |
| Immigrants | Sweden | 99.7 /100 | #52 | Exceptional 91.1% |
| Immigrants | Belgium | 99.7 /100 | #53 | Exceptional 91.1% |
| Macedonians | 99.7 /100 | #54 | Exceptional 91.1% |
| Serbians | 99.7 /100 | #55 | Exceptional 91.1% |
| Immigrants | Canada | 99.7 /100 | #56 | Exceptional 91.1% |
| Zimbabweans | 99.7 /100 | #57 | Exceptional 91.1% |
Demographics Similar to Alsatians by High School Diploma
In terms of high school diploma, the demographic groups most similar to Alsatians are Immigrants from Northern Africa (89.4%, a difference of 0.010%), Immigrants from Argentina (89.4%, a difference of 0.020%), Immigrants from Iraq (89.4%, a difference of 0.030%), Immigrants from Malaysia (89.3%, a difference of 0.050%), and Asian (89.4%, a difference of 0.070%).
| Demographics | Rating | Rank | High School Diploma |
| Iraqis | 73.9 /100 | #147 | Good 89.5% |
| Immigrants | Lebanon | 73.4 /100 | #148 | Good 89.5% |
| Immigrants | Poland | 72.9 /100 | #149 | Good 89.5% |
| Argentineans | 72.3 /100 | #150 | Good 89.5% |
| Paraguayans | 71.4 /100 | #151 | Good 89.5% |
| Asians | 70.7 /100 | #152 | Good 89.4% |
| Immigrants | Iraq | 68.7 /100 | #153 | Good 89.4% |
| Alsatians | 66.8 /100 | #154 | Good 89.4% |
| Immigrants | Northern Africa | 66.4 /100 | #155 | Good 89.4% |
| Immigrants | Argentina | 65.5 /100 | #156 | Good 89.4% |
| Immigrants | Malaysia | 63.5 /100 | #157 | Good 89.3% |
| Immigrants | Pakistan | 62.5 /100 | #158 | Good 89.3% |
| Immigrants | China | 62.0 /100 | #159 | Good 89.3% |
| Laotians | 61.8 /100 | #160 | Good 89.3% |
| Brazilians | 61.2 /100 | #161 | Good 89.3% |