U.S. Virgin Islander vs Immigrants from Caribbean Unemployment Among Ages 20 to 24 years
COMPARE
U.S. Virgin Islander
Immigrants from Caribbean
Unemployment Among Ages 20 to 24 years
Unemployment Among Ages 20 to 24 years Comparison
U.S. Virgin Islanders
Immigrants from Caribbean
11.8%
UNEMPLOYMENT AMONG AGES 20 TO 24 YEARS
0.0/ 100
METRIC RATING
288th/ 347
METRIC RANK
11.8%
UNEMPLOYMENT AMONG AGES 20 TO 24 YEARS
0.0/ 100
METRIC RATING
290th/ 347
METRIC RANK
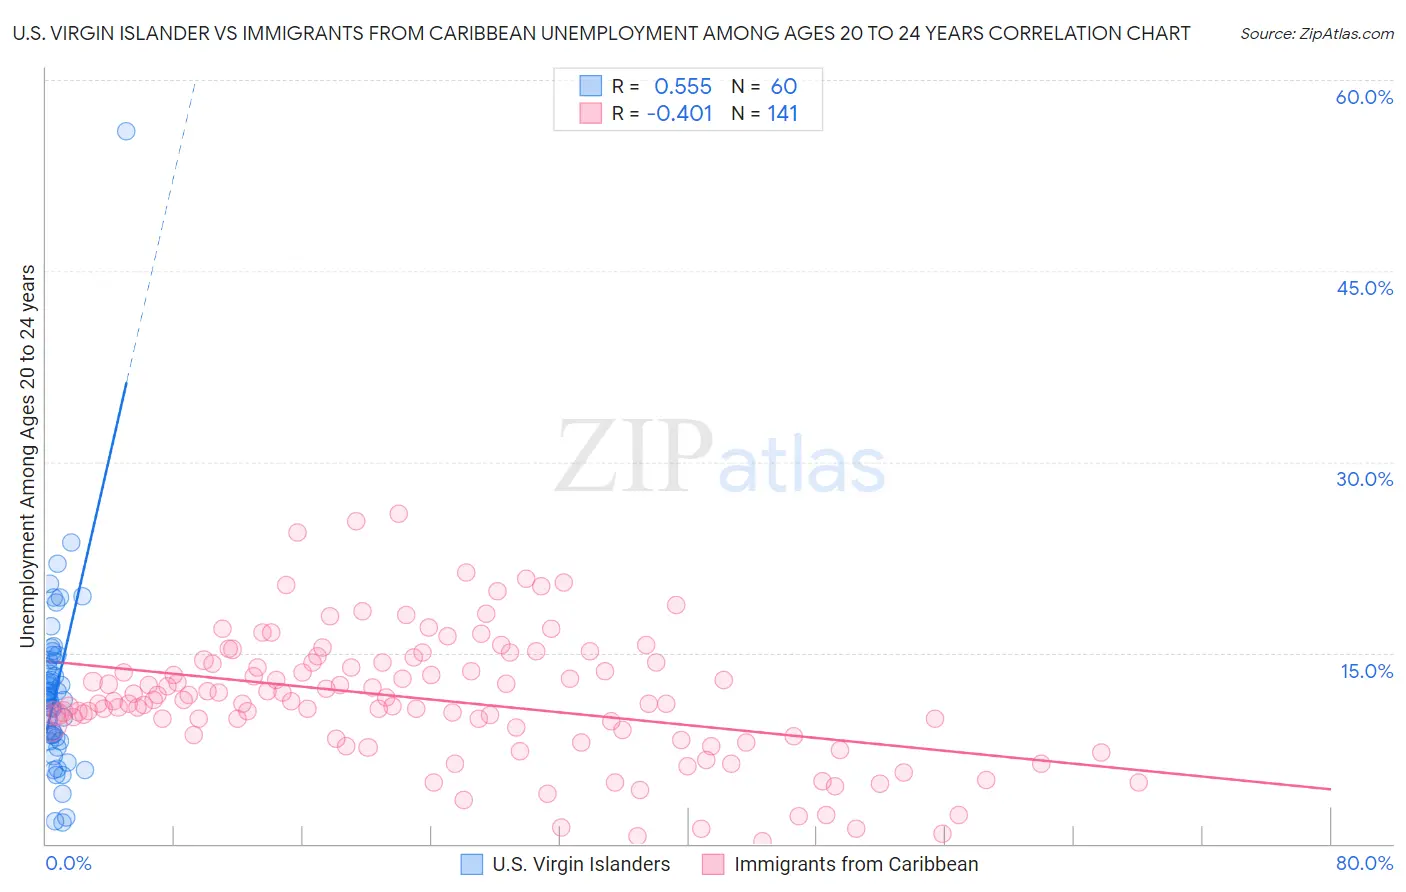
U.S. Virgin Islander vs Immigrants from Caribbean Unemployment Among Ages 20 to 24 years Correlation Chart
The statistical analysis conducted on geographies consisting of 87,085,274 people shows a substantial positive correlation between the proportion of U.S. Virgin Islanders and unemployment rate among population between the ages 20 and 24 in the United States with a correlation coefficient (R) of 0.555 and weighted average of 11.8%. Similarly, the statistical analysis conducted on geographies consisting of 433,559,576 people shows a moderate negative correlation between the proportion of Immigrants from Caribbean and unemployment rate among population between the ages 20 and 24 in the United States with a correlation coefficient (R) of -0.401 and weighted average of 11.8%, a difference of 0.51%.
Unemployment Among Ages 20 to 24 years Correlation Summary
| Measurement | U.S. Virgin Islander | Immigrants from Caribbean |
| Minimum | 1.7% | 0.20% |
| Maximum | 56.0% | 25.9% |
| Range | 54.3% | 25.7% |
| Mean | 12.1% | 11.3% |
| Median | 11.4% | 11.2% |
| Interquartile 25% (IQ1) | 8.5% | 8.3% |
| Interquartile 75% (IQ3) | 14.4% | 14.3% |
| Interquartile Range (IQR) | 5.9% | 5.9% |
| Standard Deviation (Sample) | 7.5% | 5.0% |
| Standard Deviation (Population) | 7.4% | 5.0% |
Demographics Similar to U.S. Virgin Islanders and Immigrants from Caribbean by Unemployment Among Ages 20 to 24 years
In terms of unemployment among ages 20 to 24 years, the demographic groups most similar to U.S. Virgin Islanders are Immigrants from Ecuador (11.8%, a difference of 0.050%), Ecuadorian (11.8%, a difference of 0.14%), Soviet Union (11.7%, a difference of 0.27%), Belizean (11.8%, a difference of 0.29%), and Immigrants from Western Africa (11.7%, a difference of 0.30%). Similarly, the demographic groups most similar to Immigrants from Caribbean are Belizean (11.8%, a difference of 0.21%), Immigrants from Ecuador (11.8%, a difference of 0.56%), Ecuadorian (11.8%, a difference of 0.65%), Central American Indian (11.9%, a difference of 0.69%), and Soviet Union (11.7%, a difference of 0.77%).
| Demographics | Rating | Rank | Unemployment Among Ages 20 to 24 years |
| Bahamians | 0.0 /100 | #279 | Tragic 11.6% |
| Alaskan Athabascans | 0.0 /100 | #280 | Tragic 11.6% |
| Armenians | 0.0 /100 | #281 | Tragic 11.7% |
| Immigrants | Cameroon | 0.0 /100 | #282 | Tragic 11.7% |
| Ghanaians | 0.0 /100 | #283 | Tragic 11.7% |
| Immigrants | Western Africa | 0.0 /100 | #284 | Tragic 11.7% |
| Soviet Union | 0.0 /100 | #285 | Tragic 11.7% |
| Ecuadorians | 0.0 /100 | #286 | Tragic 11.8% |
| Immigrants | Ecuador | 0.0 /100 | #287 | Tragic 11.8% |
| U.S. Virgin Islanders | 0.0 /100 | #288 | Tragic 11.8% |
| Belizeans | 0.0 /100 | #289 | Tragic 11.8% |
| Immigrants | Caribbean | 0.0 /100 | #290 | Tragic 11.8% |
| Central American Indians | 0.0 /100 | #291 | Tragic 11.9% |
| Immigrants | Senegal | 0.0 /100 | #292 | Tragic 11.9% |
| Immigrants | Ghana | 0.0 /100 | #293 | Tragic 11.9% |
| Immigrants | Belize | 0.0 /100 | #294 | Tragic 12.0% |
| Immigrants | Armenia | 0.0 /100 | #295 | Tragic 12.0% |
| Cajuns | 0.0 /100 | #296 | Tragic 12.0% |
| Blackfeet | 0.0 /100 | #297 | Tragic 12.0% |
| Lumbee | 0.0 /100 | #298 | Tragic 12.0% |
| Apache | 0.0 /100 | #299 | Tragic 12.0% |