U.S. Virgin Islander vs Immigrants from Caribbean 1 or more Vehicles in Household
COMPARE
U.S. Virgin Islander
Immigrants from Caribbean
1 or more Vehicles in Household
1 or more Vehicles in Household Comparison
U.S. Virgin Islanders
Immigrants from Caribbean
84.6%
1 OR MORE VEHICLES IN HOUSEHOLD
0.0/ 100
METRIC RATING
310th/ 347
METRIC RANK
80.4%
1 OR MORE VEHICLES IN HOUSEHOLD
0.0/ 100
METRIC RATING
324th/ 347
METRIC RANK
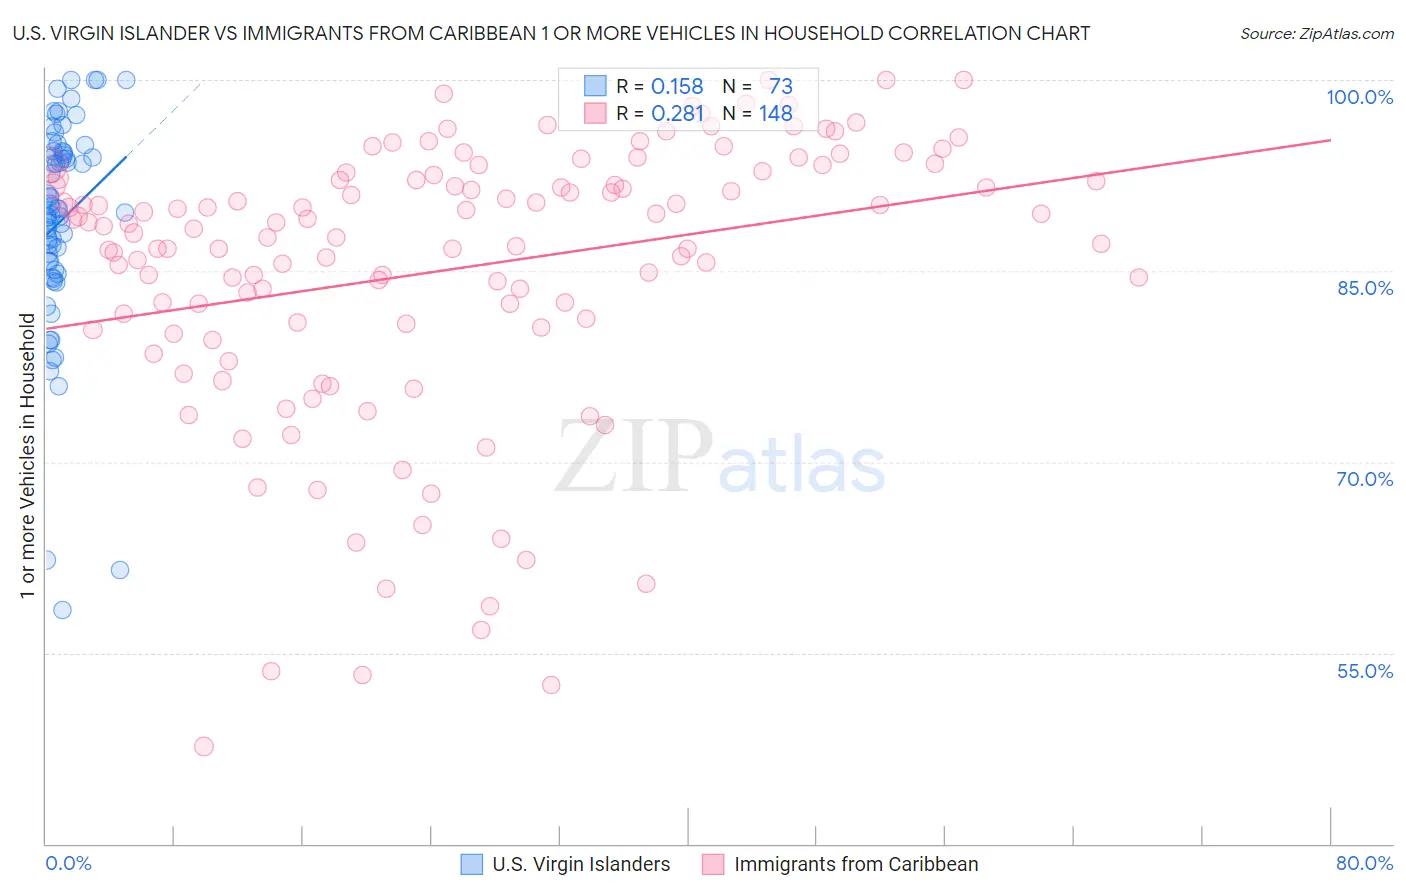
U.S. Virgin Islander vs Immigrants from Caribbean 1 or more Vehicles in Household Correlation Chart
The statistical analysis conducted on geographies consisting of 87,430,721 people shows a poor positive correlation between the proportion of U.S. Virgin Islanders and percentage of households with 1 or more vehicles available in the United States with a correlation coefficient (R) of 0.158 and weighted average of 84.6%. Similarly, the statistical analysis conducted on geographies consisting of 449,656,070 people shows a weak positive correlation between the proportion of Immigrants from Caribbean and percentage of households with 1 or more vehicles available in the United States with a correlation coefficient (R) of 0.281 and weighted average of 80.4%, a difference of 5.2%.
1 or more Vehicles in Household Correlation Summary
| Measurement | U.S. Virgin Islander | Immigrants from Caribbean |
| Minimum | 58.3% | 47.7% |
| Maximum | 100.0% | 100.0% |
| Range | 41.7% | 52.3% |
| Mean | 88.9% | 85.1% |
| Median | 89.9% | 88.4% |
| Interquartile 25% (IQ1) | 85.4% | 80.9% |
| Interquartile 75% (IQ3) | 94.3% | 92.2% |
| Interquartile Range (IQR) | 8.9% | 11.3% |
| Standard Deviation (Sample) | 8.4% | 10.9% |
| Standard Deviation (Population) | 8.3% | 10.9% |
Demographics Similar to U.S. Virgin Islanders and Immigrants from Caribbean by 1 or more Vehicles in Household
In terms of 1 or more vehicles in household, the demographic groups most similar to U.S. Virgin Islanders are Immigrants from Haiti (84.7%, a difference of 0.030%), Immigrants from Belize (84.7%, a difference of 0.040%), Puerto Rican (84.6%, a difference of 0.040%), Tohono O'odham (84.7%, a difference of 0.070%), and Cape Verdean (84.5%, a difference of 0.15%). Similarly, the demographic groups most similar to Immigrants from Caribbean are Senegalese (80.4%, a difference of 0.10%), Immigrants from Yemen (80.5%, a difference of 0.11%), Immigrants from West Indies (79.5%, a difference of 1.2%), Immigrants from Cabo Verde (81.6%, a difference of 1.4%), and Immigrants from Senegal (79.0%, a difference of 1.8%).
| Demographics | Rating | Rank | 1 or more Vehicles in Household |
| Tohono O'odham | 0.0 /100 | #307 | Tragic 84.7% |
| Immigrants | Belize | 0.0 /100 | #308 | Tragic 84.7% |
| Immigrants | Haiti | 0.0 /100 | #309 | Tragic 84.7% |
| U.S. Virgin Islanders | 0.0 /100 | #310 | Tragic 84.6% |
| Puerto Ricans | 0.0 /100 | #311 | Tragic 84.6% |
| Cape Verdeans | 0.0 /100 | #312 | Tragic 84.5% |
| Immigrants | Israel | 0.0 /100 | #313 | Tragic 84.5% |
| Albanians | 0.0 /100 | #314 | Tragic 84.4% |
| Cypriots | 0.0 /100 | #315 | Tragic 84.4% |
| Alaska Natives | 0.0 /100 | #316 | Tragic 83.8% |
| Ghanaians | 0.0 /100 | #317 | Tragic 83.6% |
| Immigrants | Ghana | 0.0 /100 | #318 | Tragic 83.4% |
| Immigrants | Belarus | 0.0 /100 | #319 | Tragic 83.3% |
| Soviet Union | 0.0 /100 | #320 | Tragic 82.7% |
| Jamaicans | 0.0 /100 | #321 | Tragic 82.1% |
| Immigrants | Cabo Verde | 0.0 /100 | #322 | Tragic 81.6% |
| Immigrants | Yemen | 0.0 /100 | #323 | Tragic 80.5% |
| Immigrants | Caribbean | 0.0 /100 | #324 | Tragic 80.4% |
| Senegalese | 0.0 /100 | #325 | Tragic 80.4% |
| Immigrants | West Indies | 0.0 /100 | #326 | Tragic 79.5% |
| Immigrants | Senegal | 0.0 /100 | #327 | Tragic 79.0% |