Uruguayan vs Immigrants from Latin America 8th Grade
COMPARE
Uruguayan
Immigrants from Latin America
8th Grade
8th Grade Comparison
Uruguayans
Immigrants from Latin America
95.1%
8TH GRADE
1.2/ 100
METRIC RATING
248th/ 347
METRIC RANK
91.7%
8TH GRADE
0.0/ 100
METRIC RATING
337th/ 347
METRIC RANK
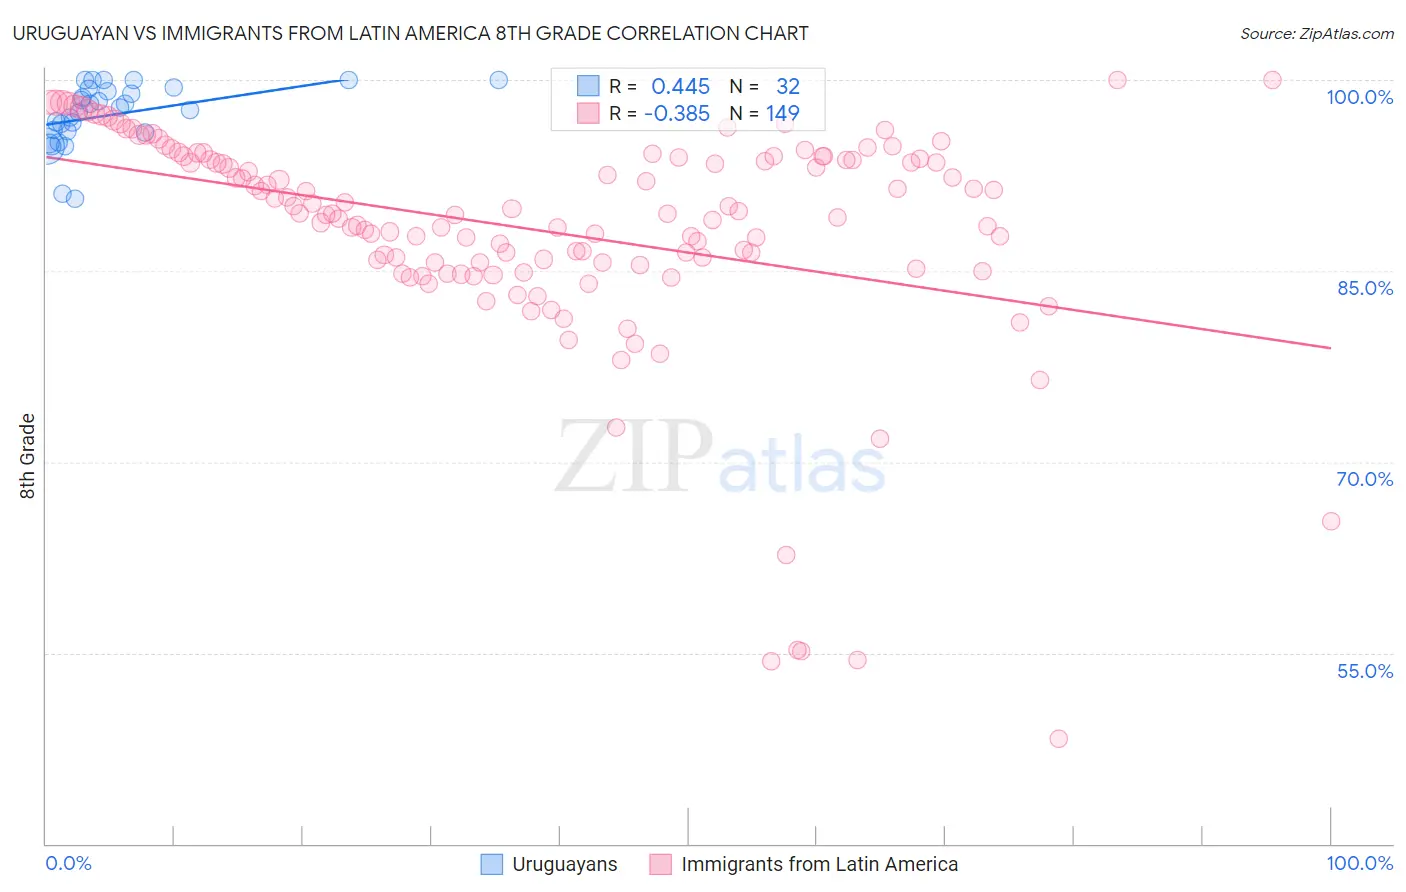
Uruguayan vs Immigrants from Latin America 8th Grade Correlation Chart
The statistical analysis conducted on geographies consisting of 144,782,794 people shows a moderate positive correlation between the proportion of Uruguayans and percentage of population with at least 8th grade education in the United States with a correlation coefficient (R) of 0.445 and weighted average of 95.1%. Similarly, the statistical analysis conducted on geographies consisting of 558,651,799 people shows a mild negative correlation between the proportion of Immigrants from Latin America and percentage of population with at least 8th grade education in the United States with a correlation coefficient (R) of -0.385 and weighted average of 91.7%, a difference of 3.7%.
8th Grade Correlation Summary
| Measurement | Uruguayan | Immigrants from Latin America |
| Minimum | 90.6% | 48.3% |
| Maximum | 100.0% | 100.0% |
| Range | 9.4% | 51.7% |
| Mean | 97.3% | 88.2% |
| Median | 97.7% | 89.5% |
| Interquartile 25% (IQ1) | 95.9% | 85.6% |
| Interquartile 75% (IQ3) | 99.2% | 94.0% |
| Interquartile Range (IQR) | 3.3% | 8.4% |
| Standard Deviation (Sample) | 2.4% | 9.0% |
| Standard Deviation (Population) | 2.4% | 8.9% |
Similar Demographics by 8th Grade
Demographics Similar to Uruguayans by 8th Grade
In terms of 8th grade, the demographic groups most similar to Uruguayans are Immigrants from Senegal (95.1%, a difference of 0.010%), Jamaican (95.1%, a difference of 0.020%), Somali (95.1%, a difference of 0.020%), Immigrants from China (95.0%, a difference of 0.020%), and Korean (95.0%, a difference of 0.020%).
| Demographics | Rating | Rank | 8th Grade |
| South American Indians | 1.9 /100 | #241 | Tragic 95.1% |
| Tongans | 1.7 /100 | #242 | Tragic 95.1% |
| Paiute | 1.7 /100 | #243 | Tragic 95.1% |
| Immigrants | Middle Africa | 1.7 /100 | #244 | Tragic 95.1% |
| Jamaicans | 1.4 /100 | #245 | Tragic 95.1% |
| Somalis | 1.4 /100 | #246 | Tragic 95.1% |
| Immigrants | Senegal | 1.4 /100 | #247 | Tragic 95.1% |
| Uruguayans | 1.2 /100 | #248 | Tragic 95.1% |
| Immigrants | China | 1.1 /100 | #249 | Tragic 95.0% |
| Koreans | 1.1 /100 | #250 | Tragic 95.0% |
| Bolivians | 1.0 /100 | #251 | Tragic 95.0% |
| Immigrants | Ethiopia | 1.0 /100 | #252 | Tragic 95.0% |
| U.S. Virgin Islanders | 0.9 /100 | #253 | Tragic 95.0% |
| Immigrants | Cameroon | 0.8 /100 | #254 | Tragic 95.0% |
| Immigrants | Somalia | 0.7 /100 | #255 | Tragic 95.0% |
Demographics Similar to Immigrants from Latin America by 8th Grade
In terms of 8th grade, the demographic groups most similar to Immigrants from Latin America are Central American (91.6%, a difference of 0.14%), Immigrants from Honduras (91.9%, a difference of 0.23%), Mexican (91.4%, a difference of 0.37%), Mexican American Indian (92.1%, a difference of 0.42%), and Immigrants from Yemen (92.1%, a difference of 0.47%).
| Demographics | Rating | Rank | 8th Grade |
| Immigrants | Armenia | 0.0 /100 | #330 | Tragic 92.3% |
| Hondurans | 0.0 /100 | #331 | Tragic 92.3% |
| Immigrants | Dominican Republic | 0.0 /100 | #332 | Tragic 92.3% |
| Hispanics or Latinos | 0.0 /100 | #333 | Tragic 92.2% |
| Immigrants | Yemen | 0.0 /100 | #334 | Tragic 92.1% |
| Mexican American Indians | 0.0 /100 | #335 | Tragic 92.1% |
| Immigrants | Honduras | 0.0 /100 | #336 | Tragic 91.9% |
| Immigrants | Latin America | 0.0 /100 | #337 | Tragic 91.7% |
| Central Americans | 0.0 /100 | #338 | Tragic 91.6% |
| Mexicans | 0.0 /100 | #339 | Tragic 91.4% |
| Yakama | 0.0 /100 | #340 | Tragic 91.2% |
| Guatemalans | 0.0 /100 | #341 | Tragic 91.1% |
| Salvadorans | 0.0 /100 | #342 | Tragic 90.9% |
| Immigrants | Guatemala | 0.0 /100 | #343 | Tragic 90.7% |
| Immigrants | Central America | 0.0 /100 | #344 | Tragic 90.4% |