Uruguayan vs Immigrants from Norway Ambulatory Disability
COMPARE
Uruguayan
Immigrants from Norway
Ambulatory Disability
Ambulatory Disability Comparison
Uruguayans
Immigrants from Norway
5.8%
AMBULATORY DISABILITY
97.2/ 100
METRIC RATING
107th/ 347
METRIC RANK
5.9%
AMBULATORY DISABILITY
90.5/ 100
METRIC RATING
129th/ 347
METRIC RANK
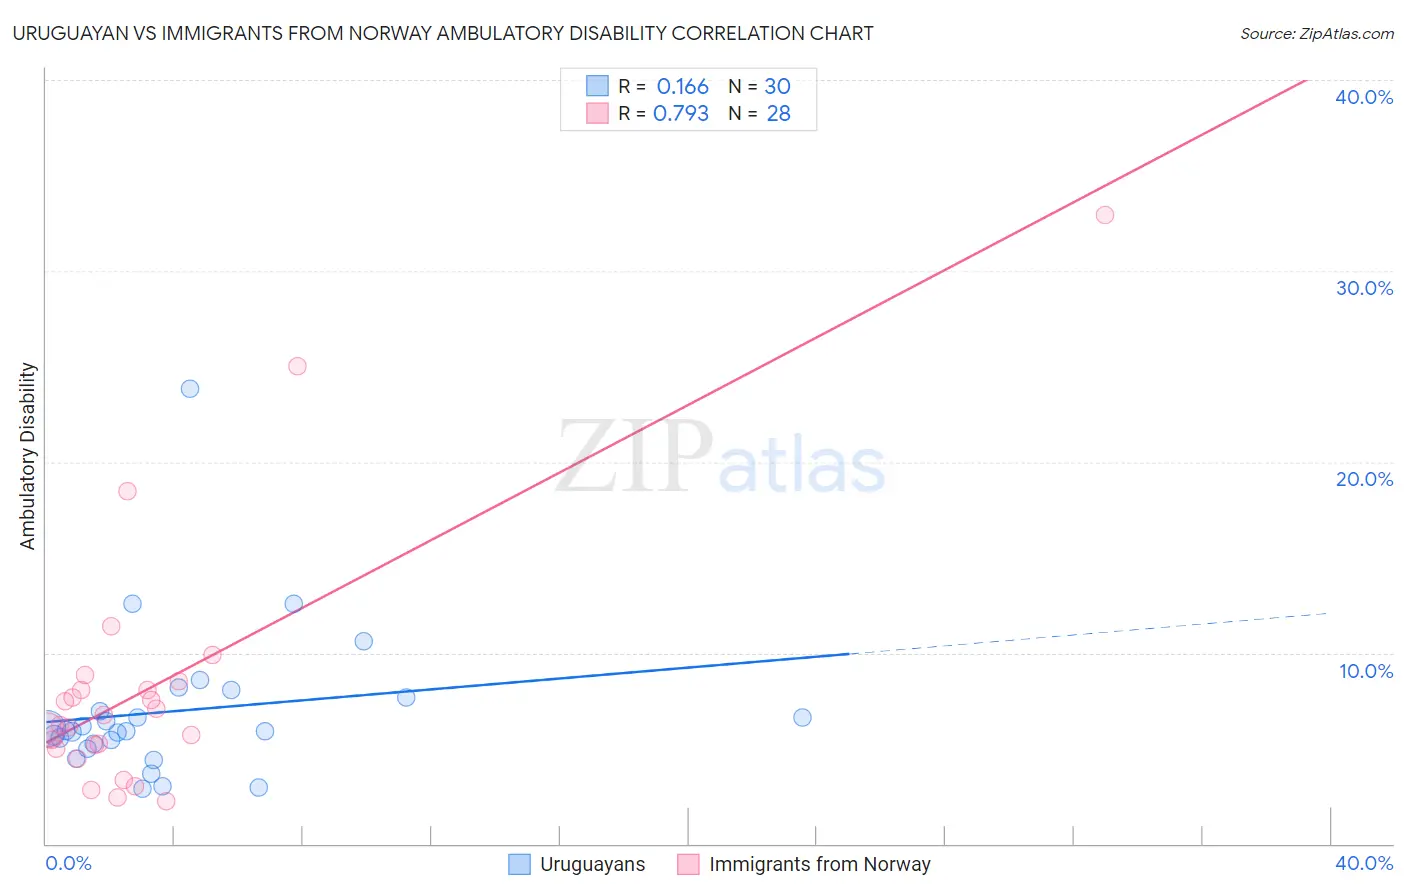
Uruguayan vs Immigrants from Norway Ambulatory Disability Correlation Chart
The statistical analysis conducted on geographies consisting of 144,780,979 people shows a poor positive correlation between the proportion of Uruguayans and percentage of population with ambulatory disability in the United States with a correlation coefficient (R) of 0.166 and weighted average of 5.8%. Similarly, the statistical analysis conducted on geographies consisting of 116,699,496 people shows a strong positive correlation between the proportion of Immigrants from Norway and percentage of population with ambulatory disability in the United States with a correlation coefficient (R) of 0.793 and weighted average of 5.9%, a difference of 1.8%.
Ambulatory Disability Correlation Summary
| Measurement | Uruguayan | Immigrants from Norway |
| Minimum | 2.9% | 2.3% |
| Maximum | 23.8% | 33.0% |
| Range | 20.9% | 30.7% |
| Mean | 6.9% | 8.2% |
| Median | 5.9% | 6.5% |
| Interquartile 25% (IQ1) | 5.3% | 5.1% |
| Interquartile 75% (IQ3) | 7.7% | 8.3% |
| Interquartile Range (IQR) | 2.4% | 3.2% |
| Standard Deviation (Sample) | 4.0% | 6.8% |
| Standard Deviation (Population) | 3.9% | 6.6% |
Similar Demographics by Ambulatory Disability
Demographics Similar to Uruguayans by Ambulatory Disability
In terms of ambulatory disability, the demographic groups most similar to Uruguayans are Colombian (5.8%, a difference of 0.010%), Immigrants from Netherlands (5.8%, a difference of 0.030%), Immigrants from Morocco (5.8%, a difference of 0.050%), Immigrants from Czechoslovakia (5.8%, a difference of 0.12%), and Immigrants from Colombia (5.8%, a difference of 0.21%).
| Demographics | Rating | Rank | Ambulatory Disability |
| Immigrants | Serbia | 97.9 /100 | #100 | Exceptional 5.8% |
| Immigrants | South America | 97.9 /100 | #101 | Exceptional 5.8% |
| Immigrants | Kenya | 97.8 /100 | #102 | Exceptional 5.8% |
| Immigrants | Romania | 97.7 /100 | #103 | Exceptional 5.8% |
| New Zealanders | 97.6 /100 | #104 | Exceptional 5.8% |
| Immigrants | Czechoslovakia | 97.4 /100 | #105 | Exceptional 5.8% |
| Immigrants | Morocco | 97.3 /100 | #106 | Exceptional 5.8% |
| Uruguayans | 97.2 /100 | #107 | Exceptional 5.8% |
| Colombians | 97.2 /100 | #108 | Exceptional 5.8% |
| Immigrants | Netherlands | 97.1 /100 | #109 | Exceptional 5.8% |
| Immigrants | Colombia | 96.7 /100 | #110 | Exceptional 5.8% |
| Danes | 96.6 /100 | #111 | Exceptional 5.8% |
| South Africans | 96.3 /100 | #112 | Exceptional 5.9% |
| Immigrants | Uruguay | 95.6 /100 | #113 | Exceptional 5.9% |
| Immigrants | Poland | 95.4 /100 | #114 | Exceptional 5.9% |
Demographics Similar to Immigrants from Norway by Ambulatory Disability
In terms of ambulatory disability, the demographic groups most similar to Immigrants from Norway are Immigrants from Western Asia (5.9%, a difference of 0.030%), Immigrants from Nigeria (5.9%, a difference of 0.070%), Immigrants from Kazakhstan (5.9%, a difference of 0.11%), Immigrants from Costa Rica (5.9%, a difference of 0.14%), and Arab (5.9%, a difference of 0.17%).
| Demographics | Rating | Rank | Ambulatory Disability |
| Icelanders | 92.6 /100 | #122 | Exceptional 5.9% |
| Immigrants | Russia | 92.4 /100 | #123 | Exceptional 5.9% |
| Immigrants | Middle Africa | 92.2 /100 | #124 | Exceptional 5.9% |
| Koreans | 91.6 /100 | #125 | Exceptional 5.9% |
| Arabs | 91.5 /100 | #126 | Exceptional 5.9% |
| Immigrants | Nigeria | 90.9 /100 | #127 | Exceptional 5.9% |
| Immigrants | Western Asia | 90.7 /100 | #128 | Exceptional 5.9% |
| Immigrants | Norway | 90.5 /100 | #129 | Exceptional 5.9% |
| Immigrants | Kazakhstan | 89.7 /100 | #130 | Excellent 5.9% |
| Immigrants | Costa Rica | 89.5 /100 | #131 | Excellent 5.9% |
| Immigrants | Europe | 87.8 /100 | #132 | Excellent 6.0% |
| Immigrants | Immigrants | 86.9 /100 | #133 | Excellent 6.0% |
| Ute | 86.6 /100 | #134 | Excellent 6.0% |
| Immigrants | Italy | 85.0 /100 | #135 | Excellent 6.0% |
| Immigrants | North Macedonia | 84.1 /100 | #136 | Excellent 6.0% |