Uruguayan vs Immigrants from Haiti Ambulatory Disability
COMPARE
Uruguayan
Immigrants from Haiti
Ambulatory Disability
Ambulatory Disability Comparison
Uruguayans
Immigrants from Haiti
5.8%
AMBULATORY DISABILITY
97.2/ 100
METRIC RATING
107th/ 347
METRIC RANK
6.5%
AMBULATORY DISABILITY
1.6/ 100
METRIC RATING
241st/ 347
METRIC RANK
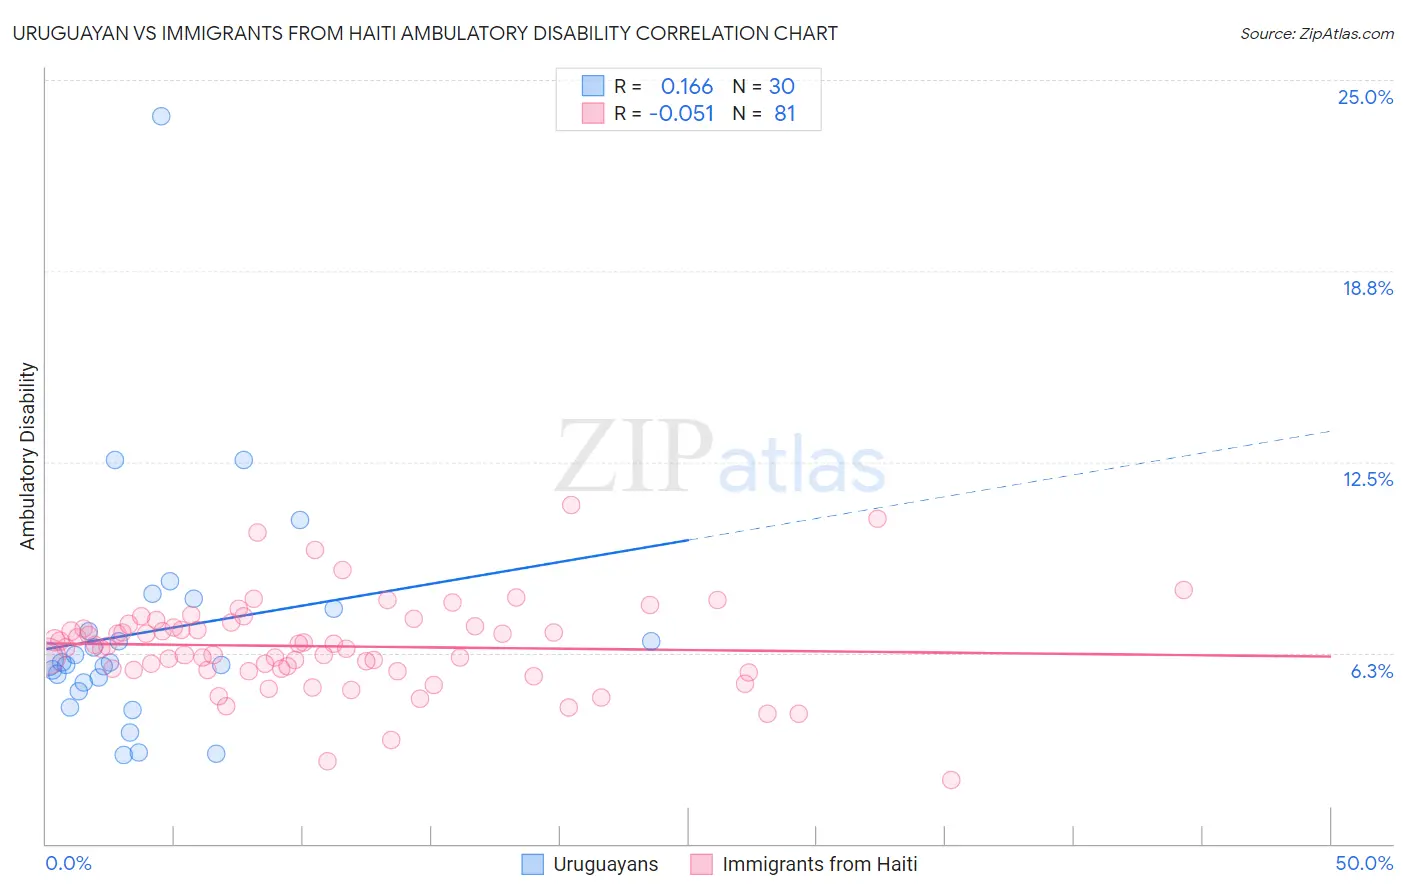
Uruguayan vs Immigrants from Haiti Ambulatory Disability Correlation Chart
The statistical analysis conducted on geographies consisting of 144,780,979 people shows a poor positive correlation between the proportion of Uruguayans and percentage of population with ambulatory disability in the United States with a correlation coefficient (R) of 0.166 and weighted average of 5.8%. Similarly, the statistical analysis conducted on geographies consisting of 225,209,570 people shows a slight negative correlation between the proportion of Immigrants from Haiti and percentage of population with ambulatory disability in the United States with a correlation coefficient (R) of -0.051 and weighted average of 6.5%, a difference of 10.7%.
Ambulatory Disability Correlation Summary
| Measurement | Uruguayan | Immigrants from Haiti |
| Minimum | 2.9% | 2.1% |
| Maximum | 23.8% | 11.1% |
| Range | 20.9% | 9.0% |
| Mean | 6.9% | 6.5% |
| Median | 5.9% | 6.5% |
| Interquartile 25% (IQ1) | 5.3% | 5.7% |
| Interquartile 75% (IQ3) | 7.7% | 7.2% |
| Interquartile Range (IQR) | 2.4% | 1.5% |
| Standard Deviation (Sample) | 4.0% | 1.5% |
| Standard Deviation (Population) | 3.9% | 1.5% |
Similar Demographics by Ambulatory Disability
Demographics Similar to Uruguayans by Ambulatory Disability
In terms of ambulatory disability, the demographic groups most similar to Uruguayans are Colombian (5.8%, a difference of 0.010%), Immigrants from Netherlands (5.8%, a difference of 0.030%), Immigrants from Morocco (5.8%, a difference of 0.050%), Immigrants from Czechoslovakia (5.8%, a difference of 0.12%), and Immigrants from Colombia (5.8%, a difference of 0.21%).
| Demographics | Rating | Rank | Ambulatory Disability |
| Immigrants | Serbia | 97.9 /100 | #100 | Exceptional 5.8% |
| Immigrants | South America | 97.9 /100 | #101 | Exceptional 5.8% |
| Immigrants | Kenya | 97.8 /100 | #102 | Exceptional 5.8% |
| Immigrants | Romania | 97.7 /100 | #103 | Exceptional 5.8% |
| New Zealanders | 97.6 /100 | #104 | Exceptional 5.8% |
| Immigrants | Czechoslovakia | 97.4 /100 | #105 | Exceptional 5.8% |
| Immigrants | Morocco | 97.3 /100 | #106 | Exceptional 5.8% |
| Uruguayans | 97.2 /100 | #107 | Exceptional 5.8% |
| Colombians | 97.2 /100 | #108 | Exceptional 5.8% |
| Immigrants | Netherlands | 97.1 /100 | #109 | Exceptional 5.8% |
| Immigrants | Colombia | 96.7 /100 | #110 | Exceptional 5.8% |
| Danes | 96.6 /100 | #111 | Exceptional 5.8% |
| South Africans | 96.3 /100 | #112 | Exceptional 5.9% |
| Immigrants | Uruguay | 95.6 /100 | #113 | Exceptional 5.9% |
| Immigrants | Poland | 95.4 /100 | #114 | Exceptional 5.9% |
Demographics Similar to Immigrants from Haiti by Ambulatory Disability
In terms of ambulatory disability, the demographic groups most similar to Immigrants from Haiti are Spaniard (6.5%, a difference of 0.030%), German (6.5%, a difference of 0.050%), Immigrants from Panama (6.5%, a difference of 0.050%), Immigrants from Senegal (6.4%, a difference of 0.080%), and Tlingit-Haida (6.5%, a difference of 0.090%).
| Demographics | Rating | Rank | Ambulatory Disability |
| Immigrants | Liberia | 2.3 /100 | #234 | Tragic 6.4% |
| Hispanics or Latinos | 2.2 /100 | #235 | Tragic 6.4% |
| Dutch | 2.0 /100 | #236 | Tragic 6.4% |
| Immigrants | Germany | 1.8 /100 | #237 | Tragic 6.4% |
| Haitians | 1.8 /100 | #238 | Tragic 6.4% |
| Senegalese | 1.7 /100 | #239 | Tragic 6.4% |
| Immigrants | Senegal | 1.7 /100 | #240 | Tragic 6.4% |
| Immigrants | Haiti | 1.6 /100 | #241 | Tragic 6.5% |
| Spaniards | 1.6 /100 | #242 | Tragic 6.5% |
| Germans | 1.5 /100 | #243 | Tragic 6.5% |
| Immigrants | Panama | 1.5 /100 | #244 | Tragic 6.5% |
| Tlingit-Haida | 1.5 /100 | #245 | Tragic 6.5% |
| Armenians | 1.5 /100 | #246 | Tragic 6.5% |
| Immigrants | Cuba | 1.4 /100 | #247 | Tragic 6.5% |
| Immigrants | Portugal | 1.4 /100 | #248 | Tragic 6.5% |