Uruguayan vs Immigrants from Latin America Child Poverty Among Boys Under 16

COMPARE

Uruguayan
Race
Ancestry
AfghanAfricanAlaska NativeAlaskan AthabascanAlbanianAleutAlsatianAmericanApacheArabArapahoArgentineanArmenianAssyrian/Chaldean/SyriacAustralianAustrianBahamianBangladeshiBarbadianBasqueBelgianBelizeanBermudanBhutaneseBlackfeetBolivianBrazilianBritishBritish West IndianBulgarianBurmeseCajunCambodianCanadianCape VerdeanCarpatho RusynCelticCentral AmericanCentral American IndianCherokeeCheyenneChickasawChileanChineseChippewaChoctawColombianColvilleComancheCosta RicanCreeCreekCroatianCrowCubanCypriotCzechCzechoslovakianDanishDelawareDominicanDutchDutch West IndianEastern EuropeanEcuadorianEgyptianEnglishEstonianEthiopianEuropeanFijianFilipinoFinnishFrenchFrench American IndianFrench CanadianGermanGerman RussianGhanaianGreekGuamanian/ChamorroGuatemalanGuyaneseHaitianHmongHonduranHopiHoumaHungarianIcelanderIndian (Asian)IndonesianInupiatIranianIraqiIrishIroquoisIsraeliItalianJamaicanJapaneseJordanianKenyanKiowaKoreanLaotianLatvianLebaneseLiberianLithuanianLumbeeLuxembourgerMacedonianMalaysianMalteseMarshalleseMenomineeMexicanMexican American IndianMongolianMoroccanNative HawaiianNavajoNepaleseNew ZealanderNicaraguanNigerianNorthern EuropeanNorwegianOkinawanOsageOttawaPaiutePakistaniPalestinianPanamanianParaguayanPennsylvania GermanPeruvianPimaPolishPortuguesePotawatomiPuebloPuerto RicanPuget Sound SalishRomanianRussianSalvadoranSamoanScandinavianScotch-IrishScottishSeminoleSenegaleseSerbianShoshoneSierra LeoneanSiouxSlavicSlovakSloveneSomaliSouth AfricanSouth AmericanSouth American IndianSoviet UnionSpaniardSpanishSpanish AmericanSpanish American IndianSri LankanSubsaharan AfricanSudaneseSwedishSwissSyrianTaiwaneseThaiTlingit-HaidaTohono O'OdhamTonganTrinidadian and TobagonianTsimshianTurkishU.S. Virgin IslanderUgandanUkrainianUruguayanUteVenezuelanVietnameseWelshWest IndianYakamaYaquiYugoslavianYumanYup'ikZimbabwean
Immigration
NonimmigrantsImmigrantsAfghanistanAfricaAlbaniaArgentinaArmeniaAsiaAustraliaAustriaBahamasBangladeshBarbadosBelarusBelgiumBelizeBoliviaBosnia and HerzegovinaBrazilBulgariaBurma/MyanmarCabo VerdeCambodiaCameroonCanadaCaribbeanCentral AmericaChileChinaColombiaCongoCosta RicaCroatiaCubaCzechoslovakiaDenmarkDominicaDominican RepublicEastern AfricaEastern AsiaEastern EuropeEcuadorEgyptEl SalvadorEnglandEritreaEthiopiaEuropeFijiFranceGermanyGhanaGreeceGrenadaGuatemalaGuyanaHaitiHondurasHong KongHungaryIndiaIndonesiaIranIraqIrelandIsraelItalyJamaicaJapanJordanKazakhstanKenyaKoreaKuwaitLaosLatviaLebanonLiberiaLithuaniaMalaysiaMexicoMicronesiaMiddle AfricaMoldovaMoroccoNepalNetherlandsNicaraguaNigeriaNorth AmericaNorth MacedoniaNorthern AfricaNorthern EuropeNorwayOceaniaPakistanPanamaPeruPhilippinesPolandPortugalRomaniaRussiaSaudi ArabiaScotlandSenegalSerbiaSierra LeoneSingaporeSomaliaSouth AfricaSouth AmericaSouth Central AsiaSouth Eastern AsiaSouthern EuropeSpainSri LankaSt. Vincent and the GrenadinesSudanSwedenSwitzerlandSyriaTaiwanThailandTrinidad and TobagoTurkeyUgandaUkraineUruguayUzbekistanVenezuelaVietnamWest IndiesWestern AfricaWestern AsiaWestern EuropeYemenZaireZimbabweAzores
Immigrants from Latin America
Race
Ancestry
AfghanAfricanAlaska NativeAlaskan AthabascanAlbanianAleutAlsatianAmericanApacheArabArapahoArgentineanArmenianAssyrian/Chaldean/SyriacAustralianAustrianBahamianBangladeshiBarbadianBasqueBelgianBelizeanBermudanBhutaneseBlackfeetBolivianBrazilianBritishBritish West IndianBulgarianBurmeseCajunCambodianCanadianCape VerdeanCarpatho RusynCelticCentral AmericanCentral American IndianCherokeeCheyenneChickasawChileanChineseChippewaChoctawColombianColvilleComancheCosta RicanCreeCreekCroatianCrowCubanCypriotCzechCzechoslovakianDanishDelawareDominicanDutchDutch West IndianEastern EuropeanEcuadorianEgyptianEnglishEstonianEthiopianEuropeanFijianFilipinoFinnishFrenchFrench American IndianFrench CanadianGermanGerman RussianGhanaianGreekGuamanian/ChamorroGuatemalanGuyaneseHaitianHmongHonduranHopiHoumaHungarianIcelanderIndian (Asian)IndonesianInupiatIranianIraqiIrishIroquoisIsraeliItalianJamaicanJapaneseJordanianKenyanKiowaKoreanLaotianLatvianLebaneseLiberianLithuanianLumbeeLuxembourgerMacedonianMalaysianMalteseMarshalleseMenomineeMexicanMexican American IndianMongolianMoroccanNative HawaiianNavajoNepaleseNew ZealanderNicaraguanNigerianNorthern EuropeanNorwegianOkinawanOsageOttawaPaiutePakistaniPalestinianPanamanianParaguayanPennsylvania GermanPeruvianPimaPolishPortuguesePotawatomiPuebloPuerto RicanPuget Sound SalishRomanianRussianSalvadoranSamoanScandinavianScotch-IrishScottishSeminoleSenegaleseSerbianShoshoneSierra LeoneanSiouxSlavicSlovakSloveneSomaliSouth AfricanSouth AmericanSouth American IndianSoviet UnionSpaniardSpanishSpanish AmericanSpanish American IndianSri LankanSubsaharan AfricanSudaneseSwedishSwissSyrianTaiwaneseThaiTlingit-HaidaTohono O'OdhamTonganTrinidadian and TobagonianTsimshianTurkishU.S. Virgin IslanderUgandanUkrainianUteVenezuelanVietnameseWelshWest IndianYakamaYaquiYugoslavianYumanYup'ikZimbabwean
Immigration
NonimmigrantsImmigrantsAfghanistanAfricaAlbaniaArgentinaArmeniaAsiaAustraliaAustriaBahamasBangladeshBarbadosBelarusBelgiumBelizeBoliviaBosnia and HerzegovinaBrazilBulgariaBurma/MyanmarCabo VerdeCambodiaCameroonCanadaCaribbeanCentral AmericaChileChinaColombiaCongoCosta RicaCroatiaCubaCzechoslovakiaDenmarkDominicaDominican RepublicEastern AfricaEastern AsiaEastern EuropeEcuadorEgyptEl SalvadorEnglandEritreaEthiopiaEuropeFijiFranceGermanyGhanaGreeceGrenadaGuatemalaGuyanaHaitiHondurasHong KongHungaryIndiaIndonesiaIranIraqIrelandIsraelItalyJamaicaJapanJordanKazakhstanKenyaKoreaKuwaitLaosLatin AmericaLatviaLebanonLiberiaLithuaniaMalaysiaMexicoMicronesiaMiddle AfricaMoldovaMoroccoNepalNetherlandsNicaraguaNigeriaNorth AmericaNorth MacedoniaNorthern AfricaNorthern EuropeNorwayOceaniaPakistanPanamaPeruPhilippinesPolandPortugalRomaniaRussiaSaudi ArabiaScotlandSenegalSerbiaSierra LeoneSingaporeSomaliaSouth AfricaSouth AmericaSouth Central AsiaSouth Eastern AsiaSouthern EuropeSpainSri LankaSt. Vincent and the GrenadinesSudanSwedenSwitzerlandSyriaTaiwanThailandTrinidad and TobagoTurkeyUgandaUkraineUruguayUzbekistanVenezuelaVietnamWest IndiesWestern AfricaWestern AsiaWestern EuropeYemenZaireZimbabweAzores
Child Poverty Among Boys Under 16
Income
Poverty
Unemployment
Labor Participation
Family Structure
Vehicle Availability
Education Level
Disability

Child Poverty Among Boys Under 16 Comparison

Uruguayans

Immigrants from Latin America

Average
Tragic
16.4%
CHILD POVERTY AMONG BOYS UNDER 16
50.0/ 100
METRIC RATING
174th/ 347
METRIC RANK
20.6%
CHILD POVERTY AMONG BOYS UNDER 16
0.0/ 100
METRIC RATING
291st/ 347
METRIC RANK

Uruguayan vs Immigrants from Latin America Child Poverty Among Boys Under 16 Correlation Chart

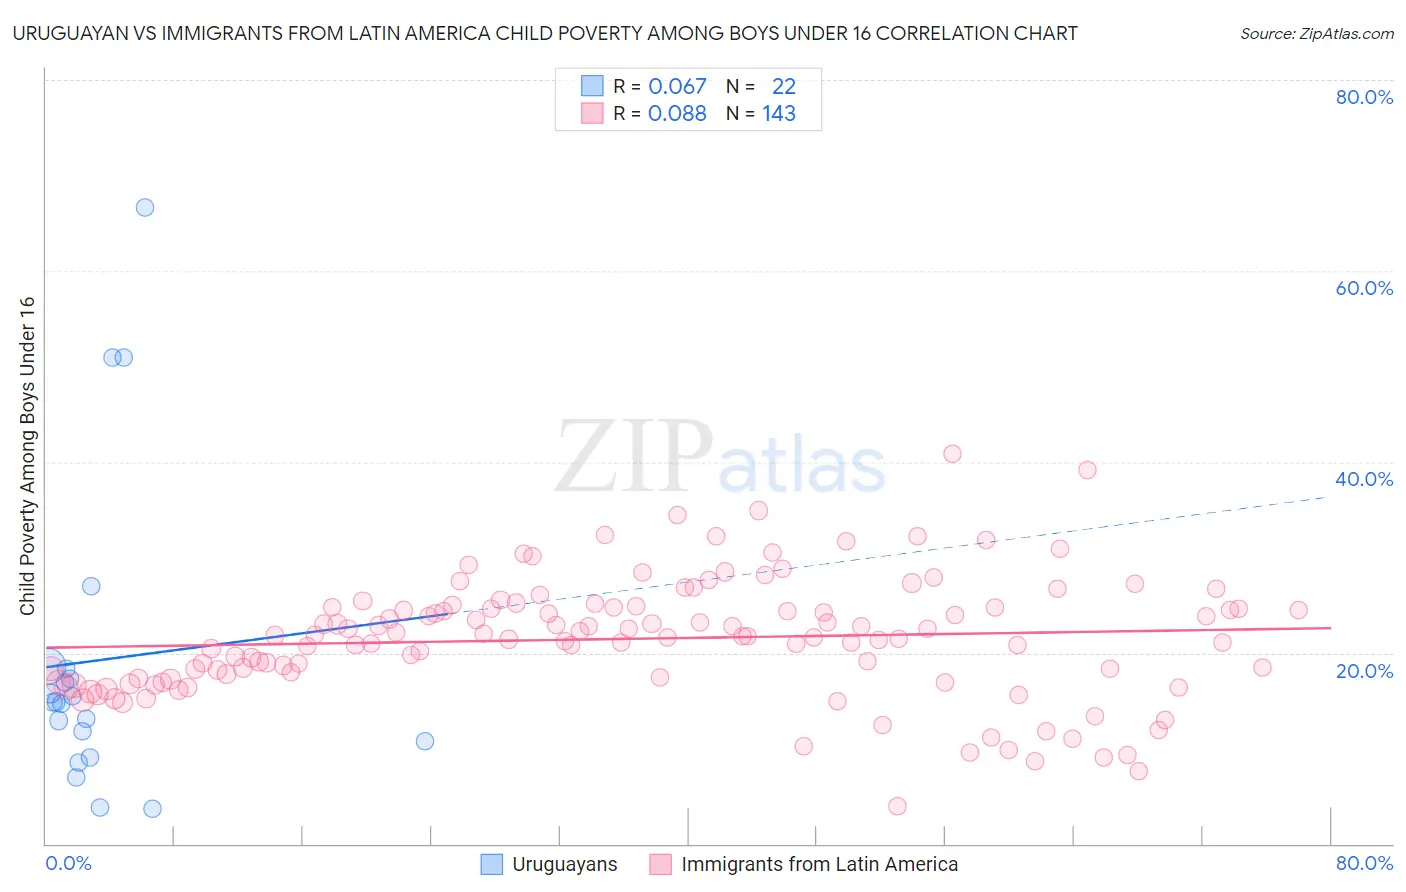
The statistical analysis conducted on geographies consisting of 143,820,486 people shows a slight positive correlation between the proportion of Uruguayans and poverty level among boys under the age of 16 in the United States with a correlation coefficient (R) of 0.067 and weighted average of 16.4%. Similarly, the statistical analysis conducted on geographies consisting of 541,398,754 people shows a slight positive correlation between the proportion of Immigrants from Latin America and poverty level among boys under the age of 16 in the United States with a correlation coefficient (R) of 0.088 and weighted average of 20.6%, a difference of 25.6%.
Uruguayan vs Immigrants from Latin America Child Poverty Among Boys Under 16

Child Poverty Among Boys Under 16 Correlation Summary

MeasurementUruguayanImmigrants from Latin America
Minimum3.7%3.9%
Maximum66.7%40.9%
Range63.0%37.0%
Mean19.2%21.5%
Median14.9%21.7%
Interquartile 25% (IQ1)10.7%17.3%
Interquartile 75% (IQ3)18.3%24.7%
Interquartile Range (IQR)7.6%7.4%
Standard Deviation (Sample)16.2%6.2%
Standard Deviation (Population)15.8%6.2%

Similar Demographics by Child Poverty Among Boys Under 16

Demographics Similar to Uruguayans by Child Poverty Among Boys Under 16

In terms of child poverty among boys under 16, the demographic groups most similar to Uruguayans are Tsimshian (16.4%, a difference of 0.060%), Immigrants from Colombia (16.4%, a difference of 0.090%), Immigrants from Syria (16.5%, a difference of 0.11%), Immigrants from Ethiopia (16.4%, a difference of 0.14%), and Immigrants from Bosnia and Herzegovina (16.4%, a difference of 0.19%).
DemographicsRating | RankChild Poverty Among Boys Under 16
Afghans
55.4
/100
|
#167
Average
16.3%
South Americans
55.3
/100
|
#168
Average
16.3%
Immigrants | Saudi Arabia
53.6
/100
|
#169
Average
16.4%
Immigrants | Bosnia and Herzegovina
51.7
/100
|
#170
Average
16.4%
Immigrants | Ethiopia
51.3
/100
|
#171
Average
16.4%
Immigrants | Colombia
50.8
/100
|
#172
Average
16.4%
Tsimshian
50.5
/100
|
#173
Average
16.4%
Uruguayans
50.0
/100
|
#174
Average
16.4%
Immigrants | Syria
49.0
/100
|
#175
Average
16.5%
Whites/Caucasians
48.2
/100
|
#176
Average
16.5%
Ethiopians
47.8
/100
|
#177
Average
16.5%
Scotch-Irish
47.5
/100
|
#178
Average
16.5%
Hungarians
47.3
/100
|
#179
Average
16.5%
Hawaiians
45.5
/100
|
#180
Average
16.5%
South American Indians
44.3
/100
|
#181
Average
16.5%

Demographics Similar to Immigrants from Latin America by Child Poverty Among Boys Under 16

In terms of child poverty among boys under 16, the demographic groups most similar to Immigrants from Latin America are Yaqui (20.7%, a difference of 0.26%), Immigrants from Senegal (20.7%, a difference of 0.27%), Immigrants from Bahamas (20.7%, a difference of 0.39%), Senegalese (20.6%, a difference of 0.44%), and Mexican (20.7%, a difference of 0.52%).
DemographicsRating | RankChild Poverty Among Boys Under 16
Barbadians
0.0
/100
|
#284
Tragic
20.2%
Arapaho
0.0
/100
|
#285
Tragic
20.2%
West Indians
0.0
/100
|
#286
Tragic
20.3%
Immigrants | Belize
0.0
/100
|
#287
Tragic
20.3%
Immigrants | St. Vincent and the Grenadines
0.0
/100
|
#288
Tragic
20.3%
Blackfeet
0.0
/100
|
#289
Tragic
20.4%
Senegalese
0.0
/100
|
#290
Tragic
20.6%
Immigrants | Latin America
0.0
/100
|
#291
Tragic
20.6%
Yaqui
0.0
/100
|
#292
Tragic
20.7%
Immigrants | Senegal
0.0
/100
|
#293
Tragic
20.7%
Immigrants | Bahamas
0.0
/100
|
#294
Tragic
20.7%
Mexicans
0.0
/100
|
#295
Tragic
20.7%
Indonesians
0.0
/100
|
#296
Tragic
20.8%
Hispanics or Latinos
0.0
/100
|
#297
Tragic
20.9%
Chippewa
0.0
/100
|
#298
Tragic
21.0%