Uruguayan vs Bermudan Ambulatory Disability
COMPARE
Uruguayan
Bermudan
Ambulatory Disability
Ambulatory Disability Comparison
Uruguayans
Bermudans
5.8%
AMBULATORY DISABILITY
97.2/ 100
METRIC RATING
107th/ 347
METRIC RANK
6.5%
AMBULATORY DISABILITY
0.5/ 100
METRIC RATING
257th/ 347
METRIC RANK
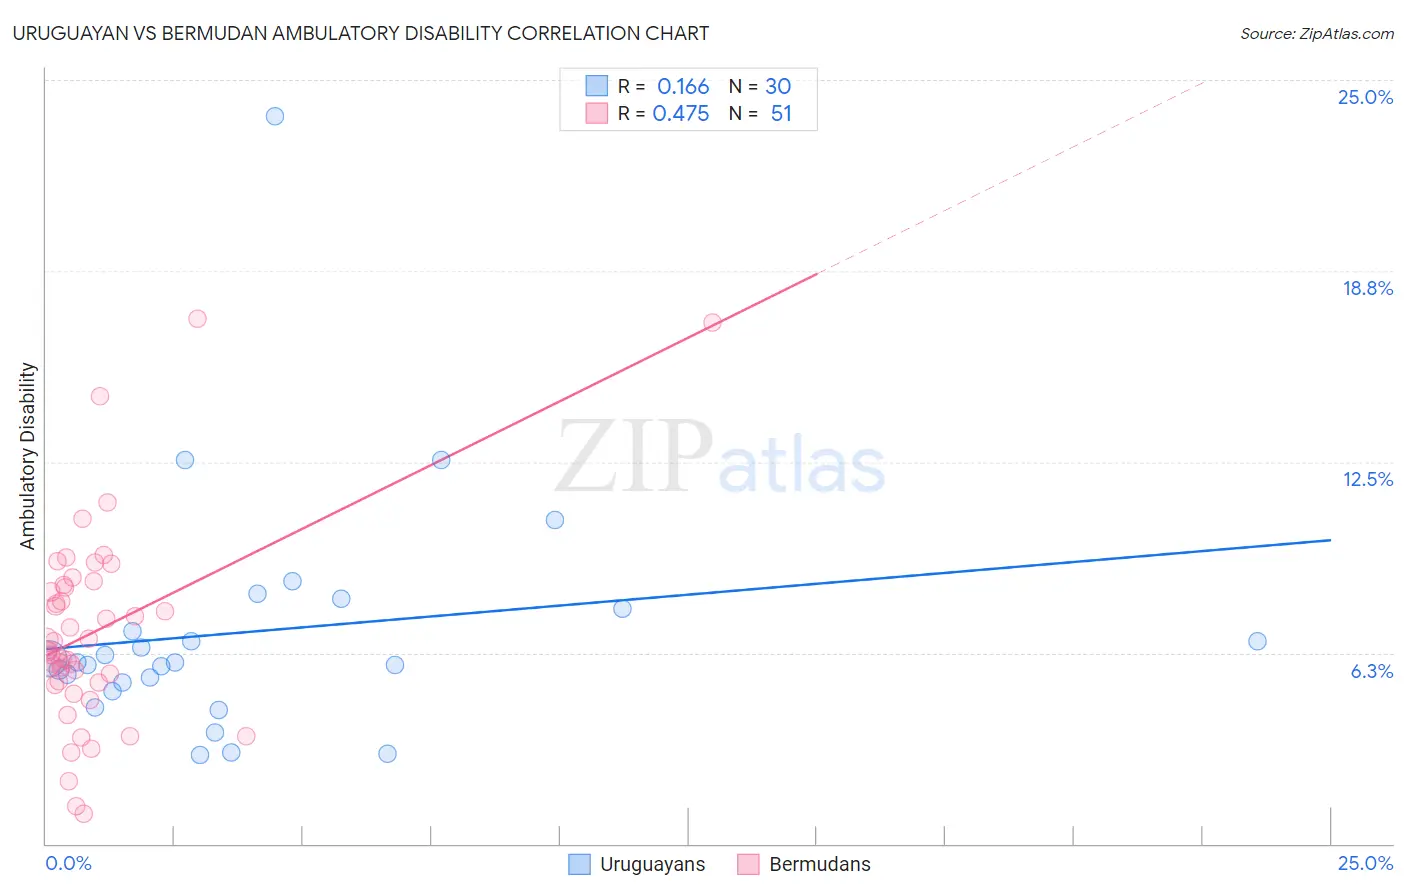
Uruguayan vs Bermudan Ambulatory Disability Correlation Chart
The statistical analysis conducted on geographies consisting of 144,780,979 people shows a poor positive correlation between the proportion of Uruguayans and percentage of population with ambulatory disability in the United States with a correlation coefficient (R) of 0.166 and weighted average of 5.8%. Similarly, the statistical analysis conducted on geographies consisting of 55,721,081 people shows a moderate positive correlation between the proportion of Bermudans and percentage of population with ambulatory disability in the United States with a correlation coefficient (R) of 0.475 and weighted average of 6.5%, a difference of 12.2%.
Ambulatory Disability Correlation Summary
| Measurement | Uruguayan | Bermudan |
| Minimum | 2.9% | 0.98% |
| Maximum | 23.8% | 17.2% |
| Range | 20.9% | 16.2% |
| Mean | 6.9% | 7.0% |
| Median | 5.9% | 6.4% |
| Interquartile 25% (IQ1) | 5.3% | 5.3% |
| Interquartile 75% (IQ3) | 7.7% | 8.5% |
| Interquartile Range (IQR) | 2.4% | 3.2% |
| Standard Deviation (Sample) | 4.0% | 3.3% |
| Standard Deviation (Population) | 3.9% | 3.2% |
Similar Demographics by Ambulatory Disability
Demographics Similar to Uruguayans by Ambulatory Disability
In terms of ambulatory disability, the demographic groups most similar to Uruguayans are Colombian (5.8%, a difference of 0.010%), Immigrants from Netherlands (5.8%, a difference of 0.030%), Immigrants from Morocco (5.8%, a difference of 0.050%), Immigrants from Czechoslovakia (5.8%, a difference of 0.12%), and Immigrants from Colombia (5.8%, a difference of 0.21%).
| Demographics | Rating | Rank | Ambulatory Disability |
| Immigrants | Serbia | 97.9 /100 | #100 | Exceptional 5.8% |
| Immigrants | South America | 97.9 /100 | #101 | Exceptional 5.8% |
| Immigrants | Kenya | 97.8 /100 | #102 | Exceptional 5.8% |
| Immigrants | Romania | 97.7 /100 | #103 | Exceptional 5.8% |
| New Zealanders | 97.6 /100 | #104 | Exceptional 5.8% |
| Immigrants | Czechoslovakia | 97.4 /100 | #105 | Exceptional 5.8% |
| Immigrants | Morocco | 97.3 /100 | #106 | Exceptional 5.8% |
| Uruguayans | 97.2 /100 | #107 | Exceptional 5.8% |
| Colombians | 97.2 /100 | #108 | Exceptional 5.8% |
| Immigrants | Netherlands | 97.1 /100 | #109 | Exceptional 5.8% |
| Immigrants | Colombia | 96.7 /100 | #110 | Exceptional 5.8% |
| Danes | 96.6 /100 | #111 | Exceptional 5.8% |
| South Africans | 96.3 /100 | #112 | Exceptional 5.9% |
| Immigrants | Uruguay | 95.6 /100 | #113 | Exceptional 5.9% |
| Immigrants | Poland | 95.4 /100 | #114 | Exceptional 5.9% |
Demographics Similar to Bermudans by Ambulatory Disability
In terms of ambulatory disability, the demographic groups most similar to Bermudans are Immigrants from Uzbekistan (6.5%, a difference of 0.080%), Spanish American Indian (6.5%, a difference of 0.080%), Welsh (6.5%, a difference of 0.16%), Belizean (6.5%, a difference of 0.23%), and Aleut (6.6%, a difference of 0.26%).
| Demographics | Rating | Rank | Ambulatory Disability |
| Chinese | 1.0 /100 | #250 | Tragic 6.5% |
| Hawaiians | 0.9 /100 | #251 | Tragic 6.5% |
| Immigrants | Bahamas | 0.8 /100 | #252 | Tragic 6.5% |
| Scottish | 0.7 /100 | #253 | Tragic 6.5% |
| Belizeans | 0.7 /100 | #254 | Tragic 6.5% |
| Welsh | 0.6 /100 | #255 | Tragic 6.5% |
| Immigrants | Uzbekistan | 0.6 /100 | #256 | Tragic 6.5% |
| Bermudans | 0.5 /100 | #257 | Tragic 6.5% |
| Spanish American Indians | 0.5 /100 | #258 | Tragic 6.5% |
| Aleuts | 0.4 /100 | #259 | Tragic 6.6% |
| Immigrants | Belize | 0.4 /100 | #260 | Tragic 6.6% |
| Irish | 0.4 /100 | #261 | Tragic 6.6% |
| English | 0.4 /100 | #262 | Tragic 6.6% |
| Hmong | 0.3 /100 | #263 | Tragic 6.6% |
| Nepalese | 0.2 /100 | #264 | Tragic 6.6% |