Turkish vs Immigrants from Denmark Vision Disability
COMPARE
Turkish
Immigrants from Denmark
Vision Disability
Vision Disability Comparison
Turks
Immigrants from Denmark
1.9%
VISION DISABILITY
100.0/ 100
METRIC RATING
21st/ 347
METRIC RANK
2.1%
VISION DISABILITY
92.9/ 100
METRIC RATING
112th/ 347
METRIC RANK
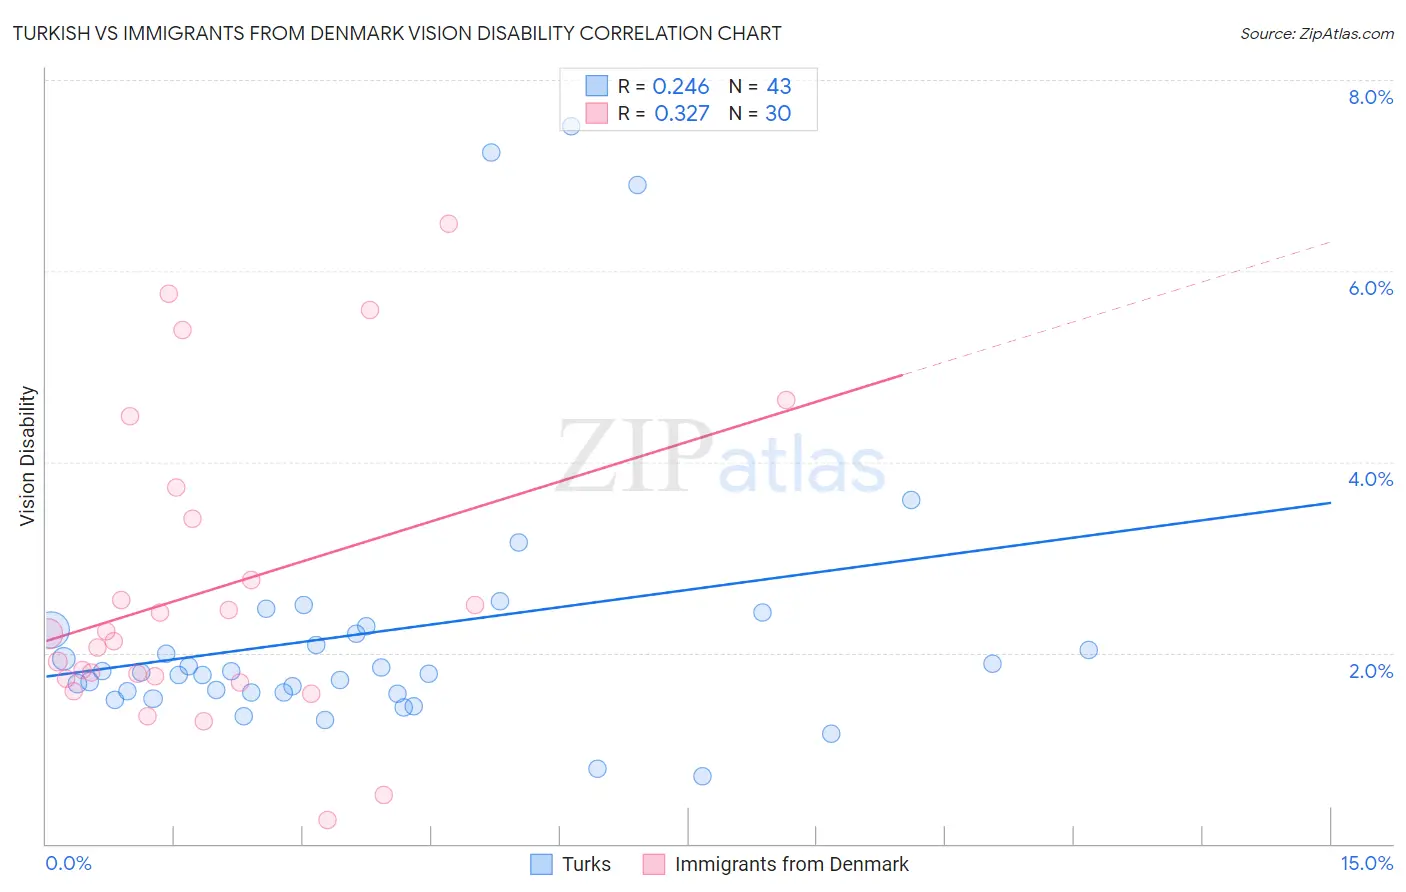
Turkish vs Immigrants from Denmark Vision Disability Correlation Chart
The statistical analysis conducted on geographies consisting of 271,748,480 people shows a weak positive correlation between the proportion of Turks and percentage of population with vision disability in the United States with a correlation coefficient (R) of 0.246 and weighted average of 1.9%. Similarly, the statistical analysis conducted on geographies consisting of 136,398,584 people shows a mild positive correlation between the proportion of Immigrants from Denmark and percentage of population with vision disability in the United States with a correlation coefficient (R) of 0.327 and weighted average of 2.1%, a difference of 9.0%.
Vision Disability Correlation Summary
| Measurement | Turkish | Immigrants from Denmark |
| Minimum | 0.70% | 0.25% |
| Maximum | 7.5% | 6.5% |
| Range | 6.8% | 6.2% |
| Mean | 2.2% | 2.7% |
| Median | 1.8% | 2.2% |
| Interquartile 25% (IQ1) | 1.6% | 1.7% |
| Interquartile 75% (IQ3) | 2.2% | 3.4% |
| Interquartile Range (IQR) | 0.65% | 1.7% |
| Standard Deviation (Sample) | 1.5% | 1.6% |
| Standard Deviation (Population) | 1.5% | 1.6% |
Similar Demographics by Vision Disability
Demographics Similar to Turks by Vision Disability
In terms of vision disability, the demographic groups most similar to Turks are Immigrants from Pakistan (1.9%, a difference of 0.050%), Asian (1.9%, a difference of 0.31%), Immigrants from Asia (1.9%, a difference of 0.59%), Immigrants from Lithuania (1.9%, a difference of 0.71%), and Bulgarian (1.9%, a difference of 0.75%).
| Demographics | Rating | Rank | Vision Disability |
| Immigrants | China | 100.0 /100 | #14 | Exceptional 1.8% |
| Immigrants | Bolivia | 100.0 /100 | #15 | Exceptional 1.8% |
| Indians (Asian) | 100.0 /100 | #16 | Exceptional 1.8% |
| Burmese | 100.0 /100 | #17 | Exceptional 1.8% |
| Bolivians | 100.0 /100 | #18 | Exceptional 1.9% |
| Immigrants | Sri Lanka | 100.0 /100 | #19 | Exceptional 1.9% |
| Asians | 100.0 /100 | #20 | Exceptional 1.9% |
| Turks | 100.0 /100 | #21 | Exceptional 1.9% |
| Immigrants | Pakistan | 100.0 /100 | #22 | Exceptional 1.9% |
| Immigrants | Asia | 99.9 /100 | #23 | Exceptional 1.9% |
| Immigrants | Lithuania | 99.9 /100 | #24 | Exceptional 1.9% |
| Bulgarians | 99.9 /100 | #25 | Exceptional 1.9% |
| Immigrants | Japan | 99.9 /100 | #26 | Exceptional 1.9% |
| Taiwanese | 99.9 /100 | #27 | Exceptional 1.9% |
| Immigrants | Malaysia | 99.9 /100 | #28 | Exceptional 1.9% |
Demographics Similar to Immigrants from Denmark by Vision Disability
In terms of vision disability, the demographic groups most similar to Immigrants from Denmark are Kenyan (2.1%, a difference of 0.12%), Croatian (2.1%, a difference of 0.15%), Peruvian (2.1%, a difference of 0.16%), Immigrants from Vietnam (2.1%, a difference of 0.18%), and Ugandan (2.1%, a difference of 0.18%).
| Demographics | Rating | Rank | Vision Disability |
| Carpatho Rusyns | 94.3 /100 | #105 | Exceptional 2.1% |
| Swedes | 94.2 /100 | #106 | Exceptional 2.1% |
| Danes | 94.2 /100 | #107 | Exceptional 2.1% |
| Koreans | 94.1 /100 | #108 | Exceptional 2.1% |
| Chileans | 94.0 /100 | #109 | Exceptional 2.1% |
| Immigrants | Armenia | 93.8 /100 | #110 | Exceptional 2.1% |
| Peruvians | 93.5 /100 | #111 | Exceptional 2.1% |
| Immigrants | Denmark | 92.9 /100 | #112 | Exceptional 2.1% |
| Kenyans | 92.5 /100 | #113 | Exceptional 2.1% |
| Croatians | 92.3 /100 | #114 | Exceptional 2.1% |
| Immigrants | Vietnam | 92.2 /100 | #115 | Exceptional 2.1% |
| Ugandans | 92.2 /100 | #116 | Exceptional 2.1% |
| Poles | 92.0 /100 | #117 | Exceptional 2.1% |
| Immigrants | Philippines | 91.4 /100 | #118 | Exceptional 2.1% |
| Immigrants | Uganda | 91.4 /100 | #119 | Exceptional 2.1% |