Tsimshian vs Sudanese Female Disability
COMPARE
Tsimshian
Sudanese
Female Disability
Female Disability Comparison
Tsimshian
Sudanese
16.8%
FEMALE DISABILITY
0.0/ 100
METRIC RATING
346th/ 347
METRIC RANK
12.0%
FEMALE DISABILITY
79.1/ 100
METRIC RATING
153rd/ 347
METRIC RANK
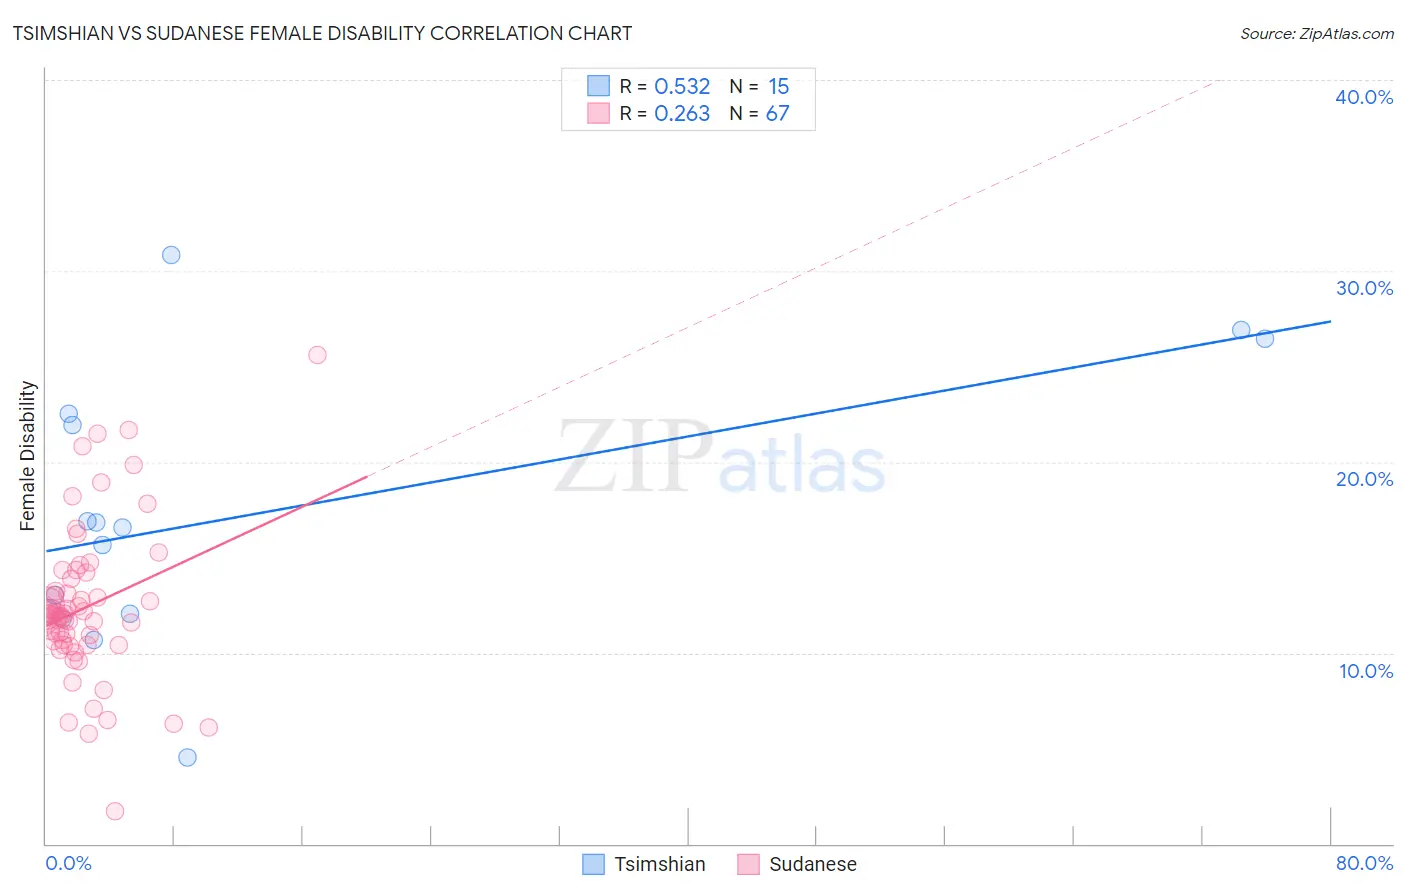
Tsimshian vs Sudanese Female Disability Correlation Chart
The statistical analysis conducted on geographies consisting of 15,626,462 people shows a substantial positive correlation between the proportion of Tsimshian and percentage of females with a disability in the United States with a correlation coefficient (R) of 0.532 and weighted average of 16.8%. Similarly, the statistical analysis conducted on geographies consisting of 110,131,007 people shows a weak positive correlation between the proportion of Sudanese and percentage of females with a disability in the United States with a correlation coefficient (R) of 0.263 and weighted average of 12.0%, a difference of 39.3%.
Female Disability Correlation Summary
| Measurement | Tsimshian | Sudanese |
| Minimum | 4.5% | 1.7% |
| Maximum | 30.9% | 25.6% |
| Range | 26.4% | 23.9% |
| Mean | 17.3% | 12.4% |
| Median | 16.6% | 12.0% |
| Interquartile 25% (IQ1) | 12.0% | 10.4% |
| Interquartile 75% (IQ3) | 22.5% | 13.9% |
| Interquartile Range (IQR) | 10.5% | 3.5% |
| Standard Deviation (Sample) | 7.2% | 4.0% |
| Standard Deviation (Population) | 6.9% | 4.0% |
Similar Demographics by Female Disability
Demographics Similar to Tsimshian by Female Disability
In terms of female disability, the demographic groups most similar to Tsimshian are Houma (16.9%, a difference of 0.77%), Puerto Rican (16.6%, a difference of 0.94%), Kiowa (15.8%, a difference of 6.2%), Lumbee (15.8%, a difference of 6.3%), and Creek (15.7%, a difference of 7.1%).
| Demographics | Rating | Rank | Female Disability |
| Immigrants | Azores | 0.0 /100 | #333 | Tragic 14.9% |
| Cherokee | 0.0 /100 | #334 | Tragic 14.9% |
| Cajuns | 0.0 /100 | #335 | Tragic 14.9% |
| Seminole | 0.0 /100 | #336 | Tragic 15.0% |
| Tohono O'odham | 0.0 /100 | #337 | Tragic 15.0% |
| Dutch West Indians | 0.0 /100 | #338 | Tragic 15.0% |
| Colville | 0.0 /100 | #339 | Tragic 15.1% |
| Chickasaw | 0.0 /100 | #340 | Tragic 15.2% |
| Choctaw | 0.0 /100 | #341 | Tragic 15.4% |
| Creek | 0.0 /100 | #342 | Tragic 15.7% |
| Lumbee | 0.0 /100 | #343 | Tragic 15.8% |
| Kiowa | 0.0 /100 | #344 | Tragic 15.8% |
| Puerto Ricans | 0.0 /100 | #345 | Tragic 16.6% |
| Tsimshian | 0.0 /100 | #346 | Tragic 16.8% |
| Houma | 0.0 /100 | #347 | Tragic 16.9% |
Demographics Similar to Sudanese by Female Disability
In terms of female disability, the demographic groups most similar to Sudanese are Immigrants from Scotland (12.0%, a difference of 0.010%), Icelander (12.0%, a difference of 0.090%), Syrian (12.1%, a difference of 0.13%), Immigrants from Moldova (12.0%, a difference of 0.14%), and Ghanaian (12.1%, a difference of 0.14%).
| Demographics | Rating | Rank | Female Disability |
| Pakistanis | 84.6 /100 | #146 | Excellent 12.0% |
| Nigerians | 84.0 /100 | #147 | Excellent 12.0% |
| Immigrants | Kenya | 83.1 /100 | #148 | Excellent 12.0% |
| Greeks | 82.0 /100 | #149 | Excellent 12.0% |
| Immigrants | Moldova | 81.4 /100 | #150 | Excellent 12.0% |
| Icelanders | 80.7 /100 | #151 | Excellent 12.0% |
| Immigrants | Scotland | 79.3 /100 | #152 | Good 12.0% |
| Sudanese | 79.1 /100 | #153 | Good 12.0% |
| Syrians | 76.9 /100 | #154 | Good 12.1% |
| Ghanaians | 76.6 /100 | #155 | Good 12.1% |
| Moroccans | 72.9 /100 | #156 | Good 12.1% |
| Danes | 72.5 /100 | #157 | Good 12.1% |
| Immigrants | Middle Africa | 72.4 /100 | #158 | Good 12.1% |
| Immigrants | Central America | 67.7 /100 | #159 | Good 12.1% |
| Immigrants | Guatemala | 66.0 /100 | #160 | Good 12.1% |