Tsimshian vs Iraqi Female Disability
COMPARE
Tsimshian
Iraqi
Female Disability
Female Disability Comparison
Tsimshian
Iraqis
16.8%
FEMALE DISABILITY
0.0/ 100
METRIC RATING
346th/ 347
METRIC RANK
12.3%
FEMALE DISABILITY
36.0/ 100
METRIC RATING
184th/ 347
METRIC RANK
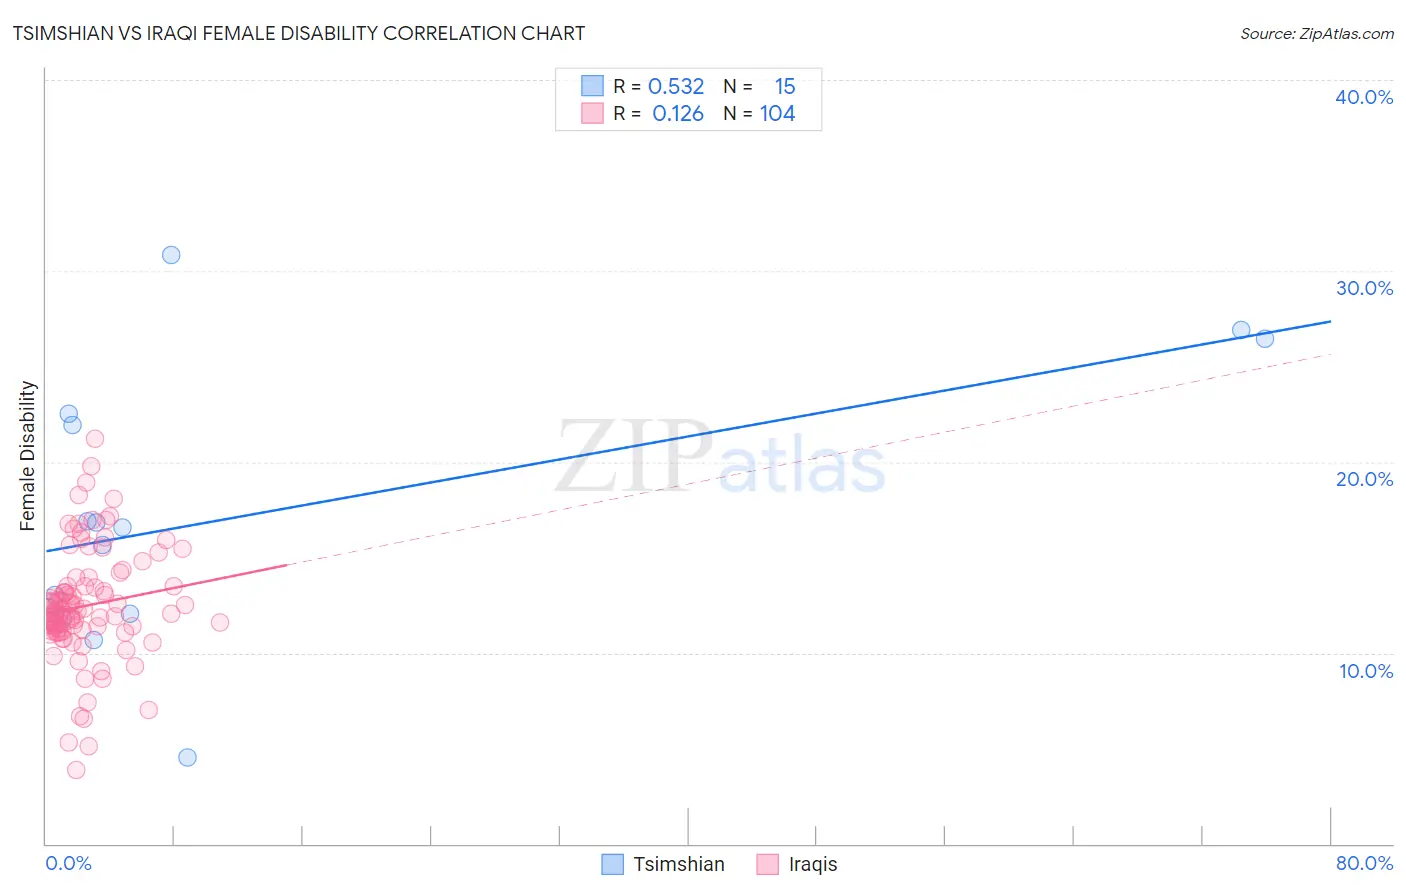
Tsimshian vs Iraqi Female Disability Correlation Chart
The statistical analysis conducted on geographies consisting of 15,626,462 people shows a substantial positive correlation between the proportion of Tsimshian and percentage of females with a disability in the United States with a correlation coefficient (R) of 0.532 and weighted average of 16.8%. Similarly, the statistical analysis conducted on geographies consisting of 170,640,782 people shows a poor positive correlation between the proportion of Iraqis and percentage of females with a disability in the United States with a correlation coefficient (R) of 0.126 and weighted average of 12.3%, a difference of 36.8%.
Female Disability Correlation Summary
| Measurement | Tsimshian | Iraqi |
| Minimum | 4.5% | 3.8% |
| Maximum | 30.9% | 21.2% |
| Range | 26.4% | 17.3% |
| Mean | 17.3% | 12.5% |
| Median | 16.6% | 12.1% |
| Interquartile 25% (IQ1) | 12.0% | 11.2% |
| Interquartile 75% (IQ3) | 22.5% | 13.5% |
| Interquartile Range (IQR) | 10.5% | 2.3% |
| Standard Deviation (Sample) | 7.2% | 3.0% |
| Standard Deviation (Population) | 6.9% | 2.9% |
Similar Demographics by Female Disability
Demographics Similar to Tsimshian by Female Disability
In terms of female disability, the demographic groups most similar to Tsimshian are Houma (16.9%, a difference of 0.77%), Puerto Rican (16.6%, a difference of 0.94%), Kiowa (15.8%, a difference of 6.2%), Lumbee (15.8%, a difference of 6.3%), and Creek (15.7%, a difference of 7.1%).
| Demographics | Rating | Rank | Female Disability |
| Immigrants | Azores | 0.0 /100 | #333 | Tragic 14.9% |
| Cherokee | 0.0 /100 | #334 | Tragic 14.9% |
| Cajuns | 0.0 /100 | #335 | Tragic 14.9% |
| Seminole | 0.0 /100 | #336 | Tragic 15.0% |
| Tohono O'odham | 0.0 /100 | #337 | Tragic 15.0% |
| Dutch West Indians | 0.0 /100 | #338 | Tragic 15.0% |
| Colville | 0.0 /100 | #339 | Tragic 15.1% |
| Chickasaw | 0.0 /100 | #340 | Tragic 15.2% |
| Choctaw | 0.0 /100 | #341 | Tragic 15.4% |
| Creek | 0.0 /100 | #342 | Tragic 15.7% |
| Lumbee | 0.0 /100 | #343 | Tragic 15.8% |
| Kiowa | 0.0 /100 | #344 | Tragic 15.8% |
| Puerto Ricans | 0.0 /100 | #345 | Tragic 16.6% |
| Tsimshian | 0.0 /100 | #346 | Tragic 16.8% |
| Houma | 0.0 /100 | #347 | Tragic 16.9% |
Demographics Similar to Iraqis by Female Disability
In terms of female disability, the demographic groups most similar to Iraqis are Cuban (12.3%, a difference of 0.020%), Norwegian (12.3%, a difference of 0.040%), Immigrants from Canada (12.3%, a difference of 0.050%), Albanian (12.3%, a difference of 0.080%), and Immigrants from Uzbekistan (12.3%, a difference of 0.080%).
| Demographics | Rating | Rank | Female Disability |
| Immigrants | Ghana | 42.5 /100 | #177 | Average 12.2% |
| Immigrants | Western Europe | 40.9 /100 | #178 | Average 12.2% |
| Immigrants | Fiji | 38.2 /100 | #179 | Fair 12.3% |
| Albanians | 37.9 /100 | #180 | Fair 12.3% |
| Immigrants | Canada | 37.2 /100 | #181 | Fair 12.3% |
| Norwegians | 36.9 /100 | #182 | Fair 12.3% |
| Cubans | 36.5 /100 | #183 | Fair 12.3% |
| Iraqis | 36.0 /100 | #184 | Fair 12.3% |
| Immigrants | Uzbekistan | 33.9 /100 | #185 | Fair 12.3% |
| Austrians | 33.3 /100 | #186 | Fair 12.3% |
| Serbians | 33.1 /100 | #187 | Fair 12.3% |
| Immigrants | North America | 32.8 /100 | #188 | Fair 12.3% |
| Immigrants | Albania | 31.6 /100 | #189 | Fair 12.3% |
| Immigrants | Honduras | 31.3 /100 | #190 | Fair 12.3% |
| Armenians | 29.7 /100 | #191 | Fair 12.3% |