Immigrants from Panama vs Sudanese Female Disability
COMPARE
Immigrants from Panama
Sudanese
Female Disability
Female Disability Comparison
Immigrants from Panama
Sudanese
12.3%
FEMALE DISABILITY
25.5/ 100
METRIC RATING
196th/ 347
METRIC RANK
12.0%
FEMALE DISABILITY
79.1/ 100
METRIC RATING
153rd/ 347
METRIC RANK
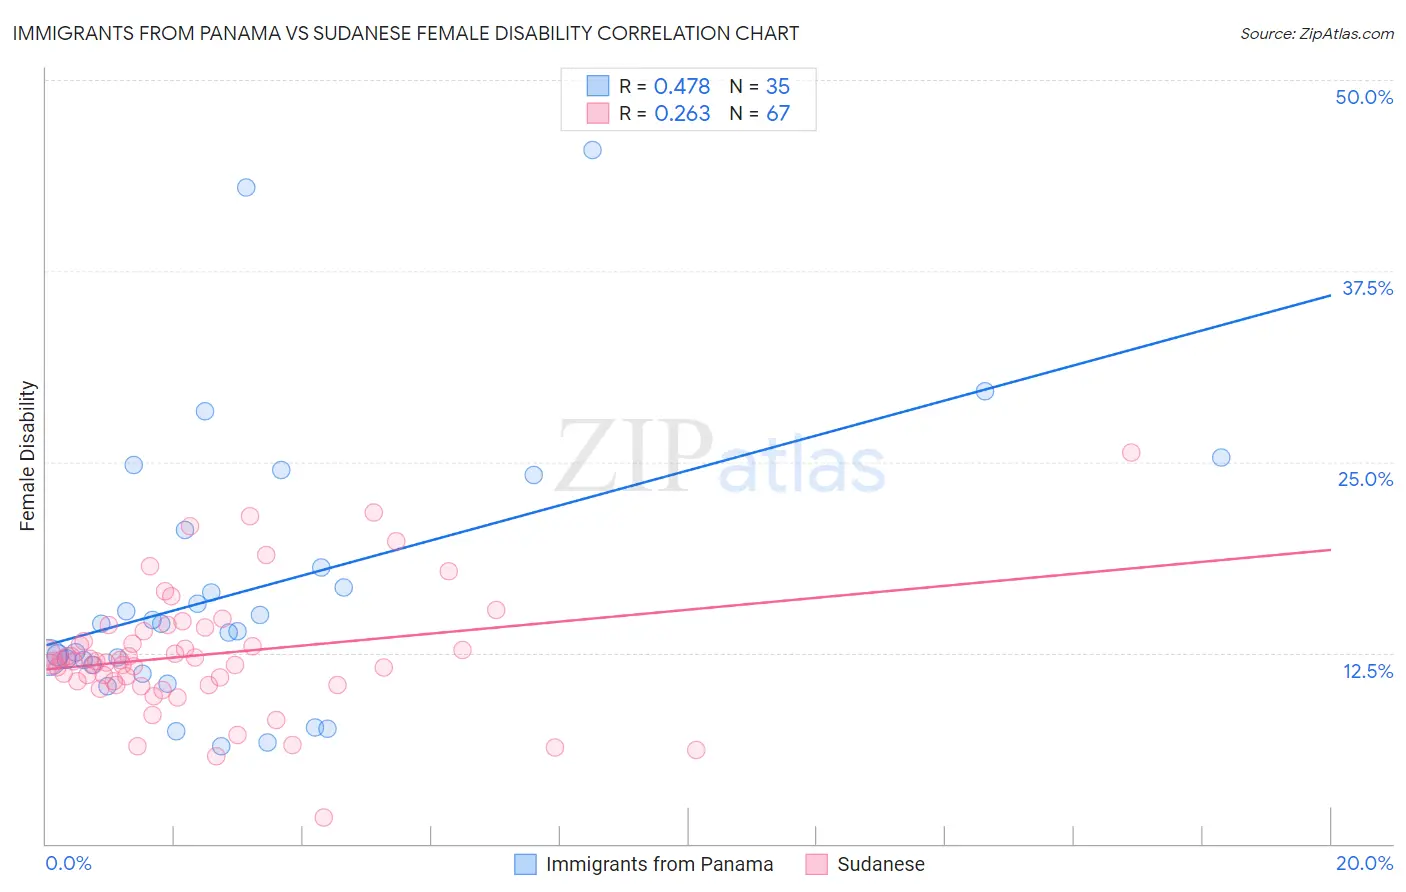
Immigrants from Panama vs Sudanese Female Disability Correlation Chart
The statistical analysis conducted on geographies consisting of 221,176,996 people shows a moderate positive correlation between the proportion of Immigrants from Panama and percentage of females with a disability in the United States with a correlation coefficient (R) of 0.478 and weighted average of 12.3%. Similarly, the statistical analysis conducted on geographies consisting of 110,131,007 people shows a weak positive correlation between the proportion of Sudanese and percentage of females with a disability in the United States with a correlation coefficient (R) of 0.263 and weighted average of 12.0%, a difference of 2.3%.
Female Disability Correlation Summary
| Measurement | Immigrants from Panama | Sudanese |
| Minimum | 6.4% | 1.7% |
| Maximum | 45.5% | 25.6% |
| Range | 39.1% | 23.9% |
| Mean | 16.8% | 12.4% |
| Median | 14.4% | 12.0% |
| Interquartile 25% (IQ1) | 11.7% | 10.4% |
| Interquartile 75% (IQ3) | 20.5% | 13.9% |
| Interquartile Range (IQR) | 8.8% | 3.5% |
| Standard Deviation (Sample) | 9.1% | 4.0% |
| Standard Deviation (Population) | 9.0% | 4.0% |
Similar Demographics by Female Disability
Demographics Similar to Immigrants from Panama by Female Disability
In terms of female disability, the demographic groups most similar to Immigrants from Panama are Honduran (12.3%, a difference of 0.0%), Mexican American Indian (12.3%, a difference of 0.030%), Immigrants from Trinidad and Tobago (12.3%, a difference of 0.040%), Swedish (12.3%, a difference of 0.060%), and Ukrainian (12.3%, a difference of 0.080%).
| Demographics | Rating | Rank | Female Disability |
| Immigrants | Albania | 31.6 /100 | #189 | Fair 12.3% |
| Immigrants | Honduras | 31.3 /100 | #190 | Fair 12.3% |
| Armenians | 29.7 /100 | #191 | Fair 12.3% |
| Immigrants | Western Africa | 29.2 /100 | #192 | Fair 12.3% |
| Northern Europeans | 27.5 /100 | #193 | Fair 12.3% |
| Ukrainians | 27.2 /100 | #194 | Fair 12.3% |
| Swedes | 26.6 /100 | #195 | Fair 12.3% |
| Immigrants | Panama | 25.5 /100 | #196 | Fair 12.3% |
| Hondurans | 25.4 /100 | #197 | Fair 12.3% |
| Mexican American Indians | 24.9 /100 | #198 | Fair 12.3% |
| Immigrants | Trinidad and Tobago | 24.7 /100 | #199 | Fair 12.3% |
| Trinidadians and Tobagonians | 22.4 /100 | #200 | Fair 12.3% |
| Chinese | 22.1 /100 | #201 | Fair 12.3% |
| Somalis | 21.5 /100 | #202 | Fair 12.3% |
| Immigrants | Barbados | 21.1 /100 | #203 | Fair 12.3% |
Demographics Similar to Sudanese by Female Disability
In terms of female disability, the demographic groups most similar to Sudanese are Immigrants from Scotland (12.0%, a difference of 0.010%), Icelander (12.0%, a difference of 0.090%), Syrian (12.1%, a difference of 0.13%), Immigrants from Moldova (12.0%, a difference of 0.14%), and Ghanaian (12.1%, a difference of 0.14%).
| Demographics | Rating | Rank | Female Disability |
| Pakistanis | 84.6 /100 | #146 | Excellent 12.0% |
| Nigerians | 84.0 /100 | #147 | Excellent 12.0% |
| Immigrants | Kenya | 83.1 /100 | #148 | Excellent 12.0% |
| Greeks | 82.0 /100 | #149 | Excellent 12.0% |
| Immigrants | Moldova | 81.4 /100 | #150 | Excellent 12.0% |
| Icelanders | 80.7 /100 | #151 | Excellent 12.0% |
| Immigrants | Scotland | 79.3 /100 | #152 | Good 12.0% |
| Sudanese | 79.1 /100 | #153 | Good 12.0% |
| Syrians | 76.9 /100 | #154 | Good 12.1% |
| Ghanaians | 76.6 /100 | #155 | Good 12.1% |
| Moroccans | 72.9 /100 | #156 | Good 12.1% |
| Danes | 72.5 /100 | #157 | Good 12.1% |
| Immigrants | Middle Africa | 72.4 /100 | #158 | Good 12.1% |
| Immigrants | Central America | 67.7 /100 | #159 | Good 12.1% |
| Immigrants | Guatemala | 66.0 /100 | #160 | Good 12.1% |