Native Hawaiian vs Sudanese Female Disability
COMPARE
Native Hawaiian
Sudanese
Female Disability
Female Disability Comparison
Native Hawaiians
Sudanese
12.4%
FEMALE DISABILITY
10.8/ 100
METRIC RATING
221st/ 347
METRIC RANK
12.0%
FEMALE DISABILITY
79.1/ 100
METRIC RATING
153rd/ 347
METRIC RANK
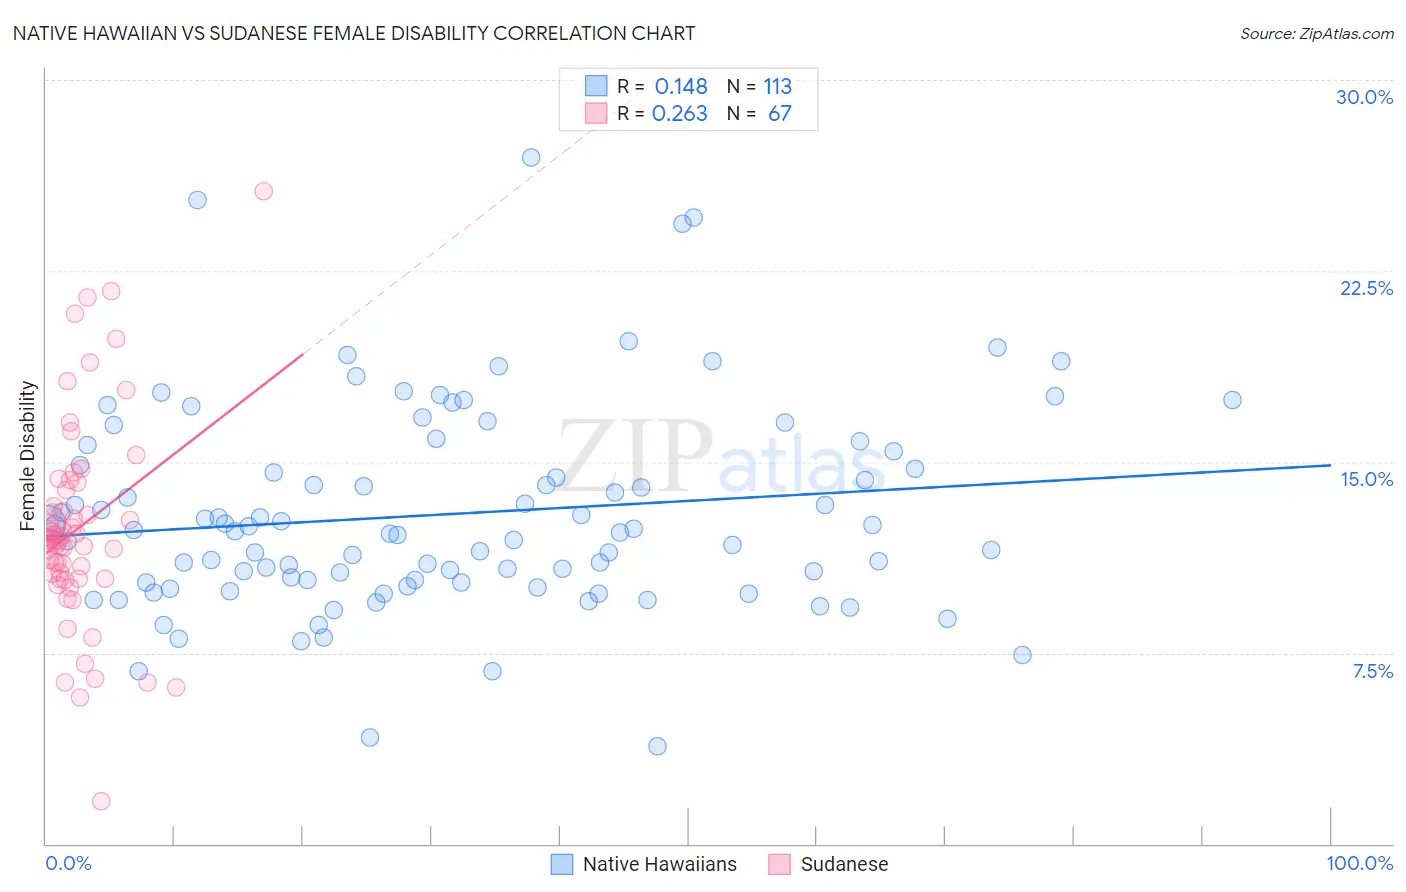
Native Hawaiian vs Sudanese Female Disability Correlation Chart
The statistical analysis conducted on geographies consisting of 332,017,231 people shows a poor positive correlation between the proportion of Native Hawaiians and percentage of females with a disability in the United States with a correlation coefficient (R) of 0.148 and weighted average of 12.4%. Similarly, the statistical analysis conducted on geographies consisting of 110,131,007 people shows a weak positive correlation between the proportion of Sudanese and percentage of females with a disability in the United States with a correlation coefficient (R) of 0.263 and weighted average of 12.0%, a difference of 3.3%.
Female Disability Correlation Summary
| Measurement | Native Hawaiian | Sudanese |
| Minimum | 3.9% | 1.7% |
| Maximum | 27.0% | 25.6% |
| Range | 23.1% | 23.9% |
| Mean | 13.0% | 12.4% |
| Median | 12.3% | 12.0% |
| Interquartile 25% (IQ1) | 10.3% | 10.4% |
| Interquartile 75% (IQ3) | 15.1% | 13.9% |
| Interquartile Range (IQR) | 4.9% | 3.5% |
| Standard Deviation (Sample) | 4.1% | 4.0% |
| Standard Deviation (Population) | 4.0% | 4.0% |
Similar Demographics by Female Disability
Demographics Similar to Native Hawaiians by Female Disability
In terms of female disability, the demographic groups most similar to Native Hawaiians are Italian (12.4%, a difference of 0.010%), Bahamian (12.4%, a difference of 0.030%), European (12.4%, a difference of 0.12%), Guamanian/Chamorro (12.5%, a difference of 0.14%), and Immigrants from Bahamas (12.4%, a difference of 0.15%).
| Demographics | Rating | Rank | Female Disability |
| Panamanians | 13.5 /100 | #214 | Poor 12.4% |
| Samoans | 13.4 /100 | #215 | Poor 12.4% |
| Immigrants | Burma/Myanmar | 13.3 /100 | #216 | Poor 12.4% |
| British | 12.7 /100 | #217 | Poor 12.4% |
| Immigrants | Bahamas | 12.5 /100 | #218 | Poor 12.4% |
| Europeans | 12.1 /100 | #219 | Poor 12.4% |
| Bahamians | 11.1 /100 | #220 | Poor 12.4% |
| Native Hawaiians | 10.8 /100 | #221 | Poor 12.4% |
| Italians | 10.7 /100 | #222 | Poor 12.4% |
| Guamanians/Chamorros | 9.5 /100 | #223 | Tragic 12.5% |
| Belizeans | 9.3 /100 | #224 | Tragic 12.5% |
| Poles | 8.4 /100 | #225 | Tragic 12.5% |
| Hispanics or Latinos | 8.0 /100 | #226 | Tragic 12.5% |
| Assyrians/Chaldeans/Syriacs | 8.0 /100 | #227 | Tragic 12.5% |
| Immigrants | Cambodia | 7.8 /100 | #228 | Tragic 12.5% |
Demographics Similar to Sudanese by Female Disability
In terms of female disability, the demographic groups most similar to Sudanese are Immigrants from Scotland (12.0%, a difference of 0.010%), Icelander (12.0%, a difference of 0.090%), Syrian (12.1%, a difference of 0.13%), Immigrants from Moldova (12.0%, a difference of 0.14%), and Ghanaian (12.1%, a difference of 0.14%).
| Demographics | Rating | Rank | Female Disability |
| Pakistanis | 84.6 /100 | #146 | Excellent 12.0% |
| Nigerians | 84.0 /100 | #147 | Excellent 12.0% |
| Immigrants | Kenya | 83.1 /100 | #148 | Excellent 12.0% |
| Greeks | 82.0 /100 | #149 | Excellent 12.0% |
| Immigrants | Moldova | 81.4 /100 | #150 | Excellent 12.0% |
| Icelanders | 80.7 /100 | #151 | Excellent 12.0% |
| Immigrants | Scotland | 79.3 /100 | #152 | Good 12.0% |
| Sudanese | 79.1 /100 | #153 | Good 12.0% |
| Syrians | 76.9 /100 | #154 | Good 12.1% |
| Ghanaians | 76.6 /100 | #155 | Good 12.1% |
| Moroccans | 72.9 /100 | #156 | Good 12.1% |
| Danes | 72.5 /100 | #157 | Good 12.1% |
| Immigrants | Middle Africa | 72.4 /100 | #158 | Good 12.1% |
| Immigrants | Central America | 67.7 /100 | #159 | Good 12.1% |
| Immigrants | Guatemala | 66.0 /100 | #160 | Good 12.1% |