Trinidadian and Tobagonian vs Immigrants from Guyana Self-Care Disability
COMPARE
Trinidadian and Tobagonian
Immigrants from Guyana
Self-Care Disability
Self-Care Disability Comparison
Trinidadians and Tobagonians
Immigrants from Guyana
2.7%
SELF-CARE DISABILITY
0.1/ 100
METRIC RATING
271st/ 347
METRIC RANK
2.8%
SELF-CARE DISABILITY
0.0/ 100
METRIC RATING
299th/ 347
METRIC RANK
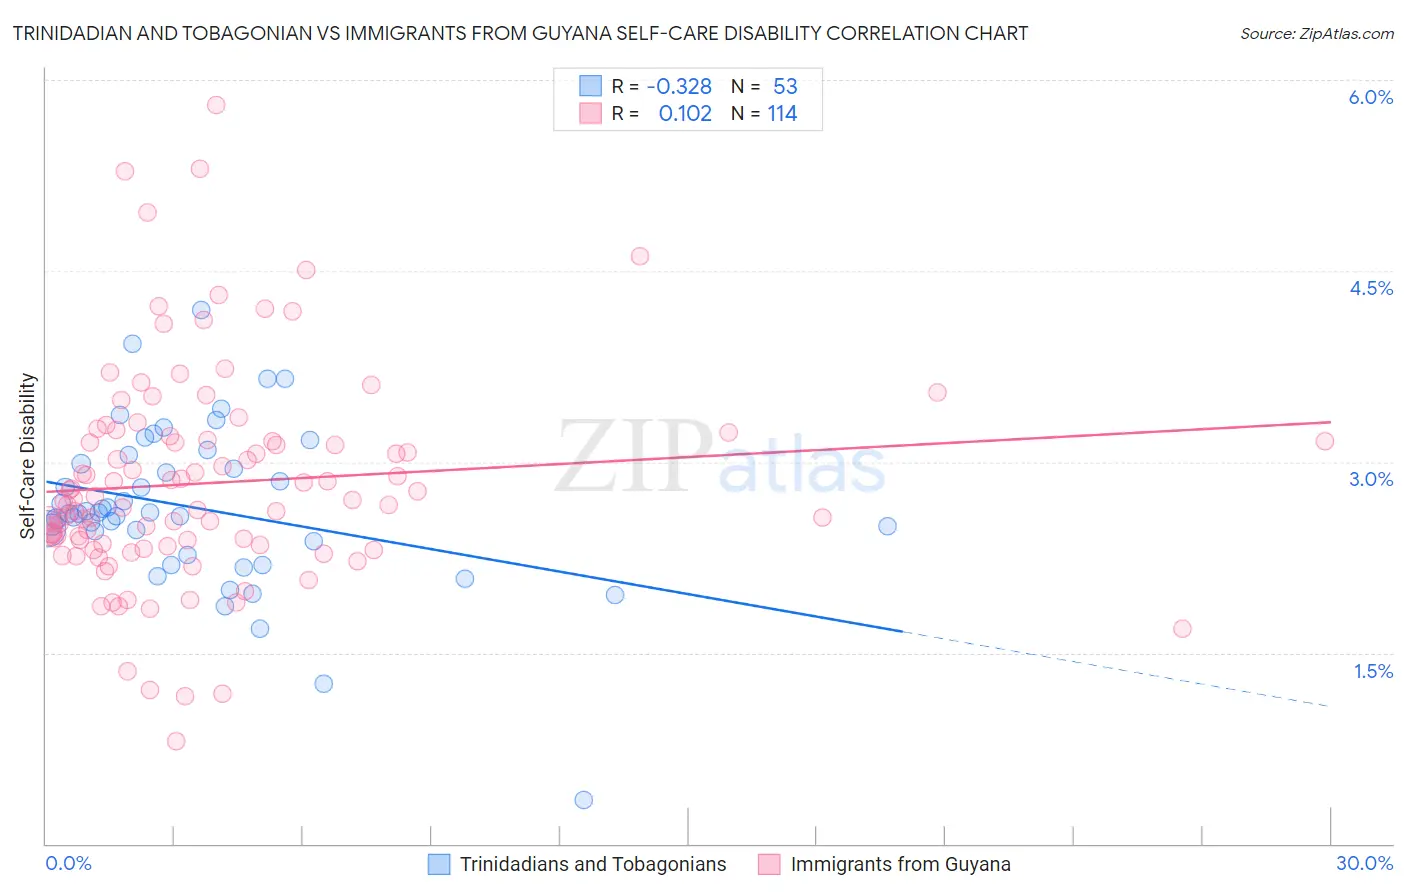
Trinidadian and Tobagonian vs Immigrants from Guyana Self-Care Disability Correlation Chart
The statistical analysis conducted on geographies consisting of 219,630,331 people shows a mild negative correlation between the proportion of Trinidadians and Tobagonians and percentage of population with self-care disability in the United States with a correlation coefficient (R) of -0.328 and weighted average of 2.7%. Similarly, the statistical analysis conducted on geographies consisting of 183,590,282 people shows a poor positive correlation between the proportion of Immigrants from Guyana and percentage of population with self-care disability in the United States with a correlation coefficient (R) of 0.102 and weighted average of 2.8%, a difference of 3.5%.
Self-Care Disability Correlation Summary
| Measurement | Trinidadian and Tobagonian | Immigrants from Guyana |
| Minimum | 0.34% | 0.80% |
| Maximum | 4.2% | 5.8% |
| Range | 3.9% | 5.0% |
| Mean | 2.6% | 2.8% |
| Median | 2.6% | 2.7% |
| Interquartile 25% (IQ1) | 2.3% | 2.3% |
| Interquartile 75% (IQ3) | 3.0% | 3.2% |
| Interquartile Range (IQR) | 0.69% | 0.83% |
| Standard Deviation (Sample) | 0.64% | 0.85% |
| Standard Deviation (Population) | 0.64% | 0.84% |
Similar Demographics by Self-Care Disability
Demographics Similar to Trinidadians and Tobagonians by Self-Care Disability
In terms of self-care disability, the demographic groups most similar to Trinidadians and Tobagonians are Immigrants from Laos (2.7%, a difference of 0.040%), Immigrants from Micronesia (2.7%, a difference of 0.060%), U.S. Virgin Islander (2.7%, a difference of 0.10%), Mexican (2.7%, a difference of 0.18%), and Yakama (2.7%, a difference of 0.24%).
| Demographics | Rating | Rank | Self-Care Disability |
| Immigrants | Iran | 0.2 /100 | #264 | Tragic 2.7% |
| Immigrants | Nicaragua | 0.2 /100 | #265 | Tragic 2.7% |
| Immigrants | Cambodia | 0.1 /100 | #266 | Tragic 2.7% |
| Yaqui | 0.1 /100 | #267 | Tragic 2.7% |
| Immigrants | Mexico | 0.1 /100 | #268 | Tragic 2.7% |
| U.S. Virgin Islanders | 0.1 /100 | #269 | Tragic 2.7% |
| Immigrants | Micronesia | 0.1 /100 | #270 | Tragic 2.7% |
| Trinidadians and Tobagonians | 0.1 /100 | #271 | Tragic 2.7% |
| Immigrants | Laos | 0.1 /100 | #272 | Tragic 2.7% |
| Mexicans | 0.1 /100 | #273 | Tragic 2.7% |
| Yakama | 0.1 /100 | #274 | Tragic 2.7% |
| Immigrants | Trinidad and Tobago | 0.1 /100 | #275 | Tragic 2.7% |
| Japanese | 0.1 /100 | #276 | Tragic 2.7% |
| Immigrants | Ukraine | 0.1 /100 | #277 | Tragic 2.7% |
| Ottawa | 0.1 /100 | #278 | Tragic 2.7% |
Demographics Similar to Immigrants from Guyana by Self-Care Disability
In terms of self-care disability, the demographic groups most similar to Immigrants from Guyana are American (2.8%, a difference of 0.090%), West Indian (2.8%, a difference of 0.21%), Immigrants from Portugal (2.8%, a difference of 0.29%), Immigrants from Fiji (2.8%, a difference of 0.47%), and Pima (2.8%, a difference of 0.56%).
| Demographics | Rating | Rank | Self-Care Disability |
| Central American Indians | 0.0 /100 | #292 | Tragic 2.7% |
| Belizeans | 0.0 /100 | #293 | Tragic 2.7% |
| Blackfeet | 0.0 /100 | #294 | Tragic 2.7% |
| Barbadians | 0.0 /100 | #295 | Tragic 2.7% |
| Immigrants | Portugal | 0.0 /100 | #296 | Tragic 2.8% |
| West Indians | 0.0 /100 | #297 | Tragic 2.8% |
| Americans | 0.0 /100 | #298 | Tragic 2.8% |
| Immigrants | Guyana | 0.0 /100 | #299 | Tragic 2.8% |
| Immigrants | Fiji | 0.0 /100 | #300 | Tragic 2.8% |
| Pima | 0.0 /100 | #301 | Tragic 2.8% |
| Immigrants | St. Vincent and the Grenadines | 0.0 /100 | #302 | Tragic 2.8% |
| Immigrants | Belize | 0.0 /100 | #303 | Tragic 2.8% |
| Cree | 0.0 /100 | #304 | Tragic 2.8% |
| Immigrants | West Indies | 0.0 /100 | #305 | Tragic 2.8% |
| Aleuts | 0.0 /100 | #306 | Tragic 2.8% |