Trinidadian and Tobagonian vs Immigrants from Afghanistan Self-Care Disability
COMPARE
Trinidadian and Tobagonian
Immigrants from Afghanistan
Self-Care Disability
Self-Care Disability Comparison
Trinidadians and Tobagonians
Immigrants from Afghanistan
2.7%
SELF-CARE DISABILITY
0.1/ 100
METRIC RATING
271st/ 347
METRIC RANK
2.5%
SELF-CARE DISABILITY
47.6/ 100
METRIC RATING
176th/ 347
METRIC RANK
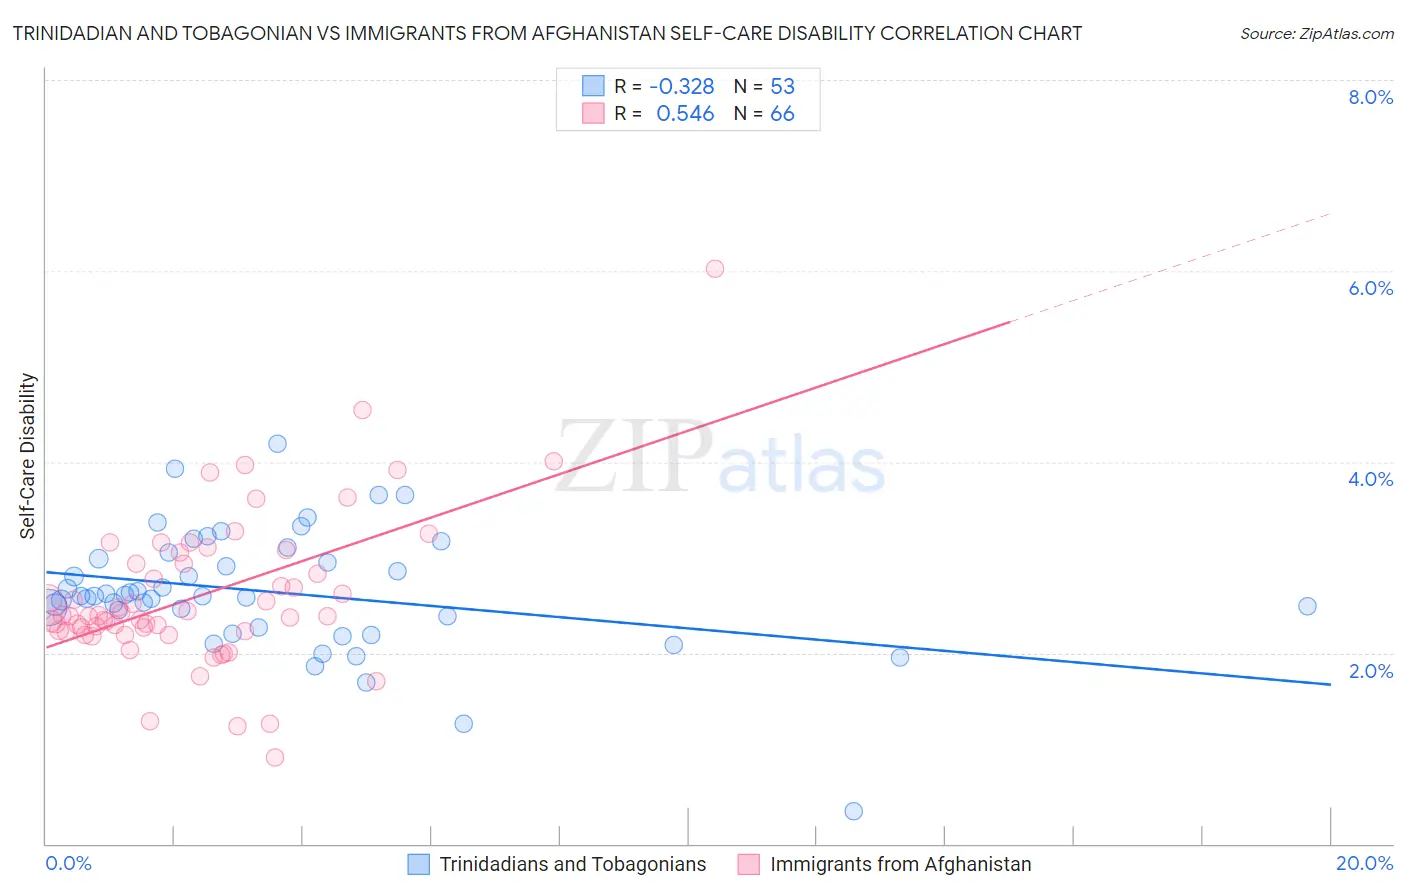
Trinidadian and Tobagonian vs Immigrants from Afghanistan Self-Care Disability Correlation Chart
The statistical analysis conducted on geographies consisting of 219,630,331 people shows a mild negative correlation between the proportion of Trinidadians and Tobagonians and percentage of population with self-care disability in the United States with a correlation coefficient (R) of -0.328 and weighted average of 2.7%. Similarly, the statistical analysis conducted on geographies consisting of 147,580,725 people shows a substantial positive correlation between the proportion of Immigrants from Afghanistan and percentage of population with self-care disability in the United States with a correlation coefficient (R) of 0.546 and weighted average of 2.5%, a difference of 8.2%.
Self-Care Disability Correlation Summary
| Measurement | Trinidadian and Tobagonian | Immigrants from Afghanistan |
| Minimum | 0.34% | 0.91% |
| Maximum | 4.2% | 6.0% |
| Range | 3.9% | 5.1% |
| Mean | 2.6% | 2.6% |
| Median | 2.6% | 2.4% |
| Interquartile 25% (IQ1) | 2.3% | 2.2% |
| Interquartile 75% (IQ3) | 3.0% | 2.9% |
| Interquartile Range (IQR) | 0.69% | 0.71% |
| Standard Deviation (Sample) | 0.64% | 0.80% |
| Standard Deviation (Population) | 0.64% | 0.80% |
Similar Demographics by Self-Care Disability
Demographics Similar to Trinidadians and Tobagonians by Self-Care Disability
In terms of self-care disability, the demographic groups most similar to Trinidadians and Tobagonians are Immigrants from Laos (2.7%, a difference of 0.040%), Immigrants from Micronesia (2.7%, a difference of 0.060%), U.S. Virgin Islander (2.7%, a difference of 0.10%), Mexican (2.7%, a difference of 0.18%), and Yakama (2.7%, a difference of 0.24%).
| Demographics | Rating | Rank | Self-Care Disability |
| Immigrants | Iran | 0.2 /100 | #264 | Tragic 2.7% |
| Immigrants | Nicaragua | 0.2 /100 | #265 | Tragic 2.7% |
| Immigrants | Cambodia | 0.1 /100 | #266 | Tragic 2.7% |
| Yaqui | 0.1 /100 | #267 | Tragic 2.7% |
| Immigrants | Mexico | 0.1 /100 | #268 | Tragic 2.7% |
| U.S. Virgin Islanders | 0.1 /100 | #269 | Tragic 2.7% |
| Immigrants | Micronesia | 0.1 /100 | #270 | Tragic 2.7% |
| Trinidadians and Tobagonians | 0.1 /100 | #271 | Tragic 2.7% |
| Immigrants | Laos | 0.1 /100 | #272 | Tragic 2.7% |
| Mexicans | 0.1 /100 | #273 | Tragic 2.7% |
| Yakama | 0.1 /100 | #274 | Tragic 2.7% |
| Immigrants | Trinidad and Tobago | 0.1 /100 | #275 | Tragic 2.7% |
| Japanese | 0.1 /100 | #276 | Tragic 2.7% |
| Immigrants | Ukraine | 0.1 /100 | #277 | Tragic 2.7% |
| Ottawa | 0.1 /100 | #278 | Tragic 2.7% |
Demographics Similar to Immigrants from Afghanistan by Self-Care Disability
In terms of self-care disability, the demographic groups most similar to Immigrants from Afghanistan are Immigrants from Kazakhstan (2.5%, a difference of 0.040%), English (2.5%, a difference of 0.070%), Immigrants from Bosnia and Herzegovina (2.5%, a difference of 0.090%), Hungarian (2.5%, a difference of 0.10%), and Welsh (2.5%, a difference of 0.11%).
| Demographics | Rating | Rank | Self-Care Disability |
| Immigrants | Somalia | 55.9 /100 | #169 | Average 2.5% |
| Scottish | 54.3 /100 | #170 | Average 2.5% |
| Pennsylvania Germans | 53.5 /100 | #171 | Average 2.5% |
| Czechoslovakians | 53.5 /100 | #172 | Average 2.5% |
| Immigrants | Burma/Myanmar | 52.8 /100 | #173 | Average 2.5% |
| Welsh | 50.0 /100 | #174 | Average 2.5% |
| Immigrants | Bosnia and Herzegovina | 49.6 /100 | #175 | Average 2.5% |
| Immigrants | Afghanistan | 47.6 /100 | #176 | Average 2.5% |
| Immigrants | Kazakhstan | 46.7 /100 | #177 | Average 2.5% |
| English | 46.2 /100 | #178 | Average 2.5% |
| Hungarians | 45.5 /100 | #179 | Average 2.5% |
| Indonesians | 41.2 /100 | #180 | Average 2.5% |
| Ghanaians | 40.4 /100 | #181 | Average 2.5% |
| Maltese | 37.5 /100 | #182 | Fair 2.5% |
| Salvadorans | 36.4 /100 | #183 | Fair 2.5% |