Trinidadian and Tobagonian vs Immigrants from Guyana Male Poverty
COMPARE
Trinidadian and Tobagonian
Immigrants from Guyana
Male Poverty
Male Poverty Comparison
Trinidadians and Tobagonians
Immigrants from Guyana
13.1%
MALE POVERTY
0.1/ 100
METRIC RATING
261st/ 347
METRIC RANK
13.2%
MALE POVERTY
0.1/ 100
METRIC RATING
266th/ 347
METRIC RANK
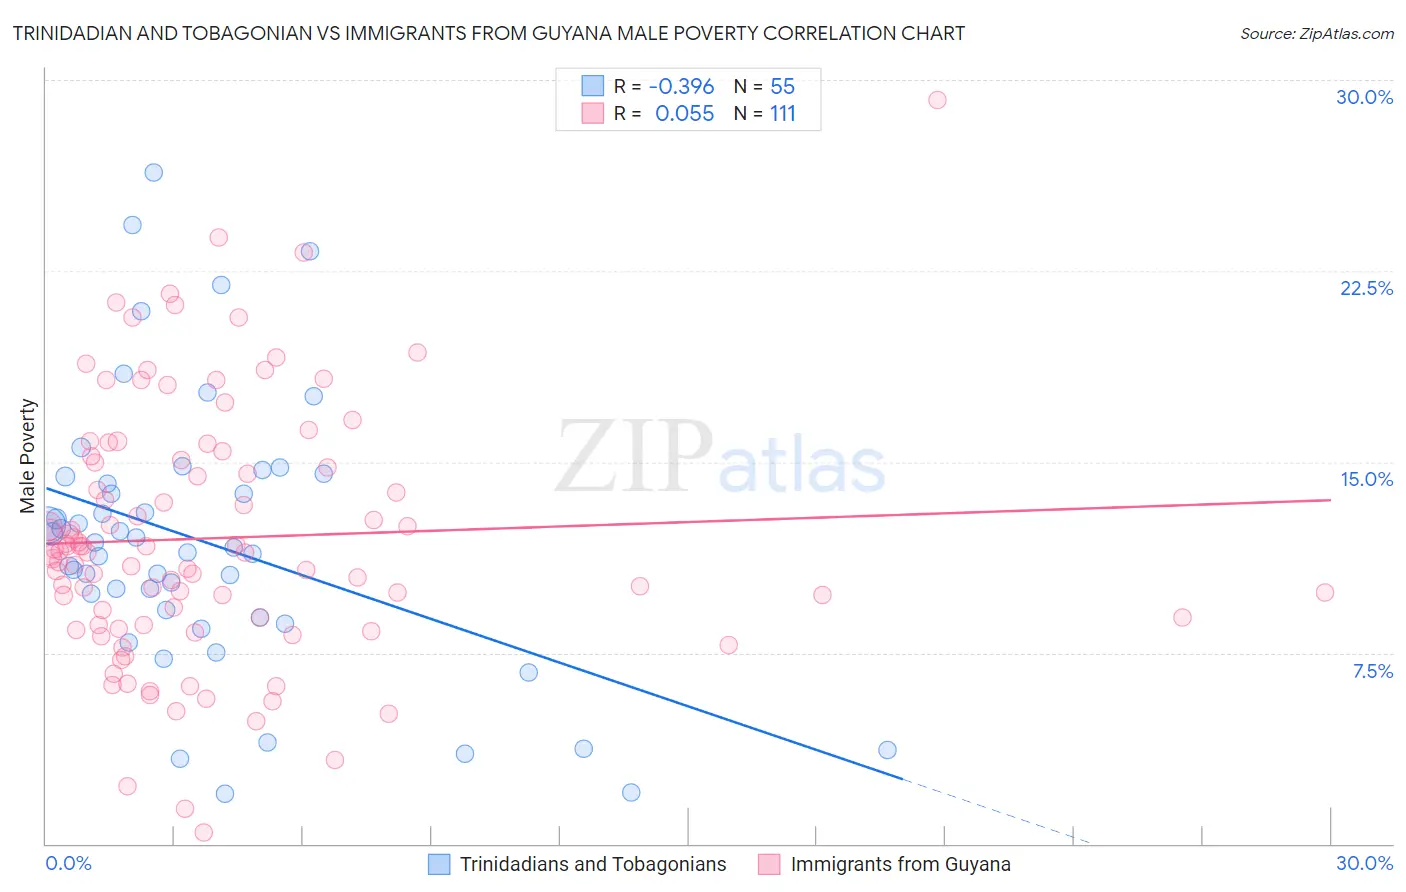
Trinidadian and Tobagonian vs Immigrants from Guyana Male Poverty Correlation Chart
The statistical analysis conducted on geographies consisting of 219,673,525 people shows a mild negative correlation between the proportion of Trinidadians and Tobagonians and poverty level among males in the United States with a correlation coefficient (R) of -0.396 and weighted average of 13.1%. Similarly, the statistical analysis conducted on geographies consisting of 183,559,274 people shows a slight positive correlation between the proportion of Immigrants from Guyana and poverty level among males in the United States with a correlation coefficient (R) of 0.055 and weighted average of 13.2%, a difference of 0.97%.
Male Poverty Correlation Summary
| Measurement | Trinidadian and Tobagonian | Immigrants from Guyana |
| Minimum | 2.0% | 0.44% |
| Maximum | 26.4% | 29.2% |
| Range | 24.4% | 28.8% |
| Mean | 11.9% | 12.0% |
| Median | 11.7% | 11.4% |
| Interquartile 25% (IQ1) | 8.9% | 8.6% |
| Interquartile 75% (IQ3) | 14.4% | 15.1% |
| Interquartile Range (IQR) | 5.5% | 6.5% |
| Standard Deviation (Sample) | 5.3% | 5.0% |
| Standard Deviation (Population) | 5.3% | 5.0% |
Demographics Similar to Trinidadians and Tobagonians and Immigrants from Guyana by Male Poverty
In terms of male poverty, the demographic groups most similar to Trinidadians and Tobagonians are Ottawa (13.1%, a difference of 0.020%), Spanish American Indian (13.1%, a difference of 0.050%), Cherokee (13.1%, a difference of 0.13%), Cape Verdean (13.1%, a difference of 0.30%), and Immigrants from Trinidad and Tobago (13.1%, a difference of 0.42%). Similarly, the demographic groups most similar to Immigrants from Guyana are Immigrants from Jamaica (13.3%, a difference of 0.11%), Jamaican (13.2%, a difference of 0.14%), Subsaharan African (13.3%, a difference of 0.14%), Iroquois (13.2%, a difference of 0.16%), and Guyanese (13.3%, a difference of 0.36%).
| Demographics | Rating | Rank | Male Poverty |
| Immigrants | Ghana | 0.2 /100 | #253 | Tragic 12.9% |
| Mexican American Indians | 0.1 /100 | #254 | Tragic 13.0% |
| Immigrants | Liberia | 0.1 /100 | #255 | Tragic 13.0% |
| Immigrants | Burma/Myanmar | 0.1 /100 | #256 | Tragic 13.0% |
| Immigrants | Trinidad and Tobago | 0.1 /100 | #257 | Tragic 13.1% |
| Cape Verdeans | 0.1 /100 | #258 | Tragic 13.1% |
| Cherokee | 0.1 /100 | #259 | Tragic 13.1% |
| Ottawa | 0.1 /100 | #260 | Tragic 13.1% |
| Trinidadians and Tobagonians | 0.1 /100 | #261 | Tragic 13.1% |
| Spanish American Indians | 0.1 /100 | #262 | Tragic 13.1% |
| Central Americans | 0.1 /100 | #263 | Tragic 13.2% |
| Iroquois | 0.1 /100 | #264 | Tragic 13.2% |
| Jamaicans | 0.1 /100 | #265 | Tragic 13.2% |
| Immigrants | Guyana | 0.1 /100 | #266 | Tragic 13.2% |
| Immigrants | Jamaica | 0.1 /100 | #267 | Tragic 13.3% |
| Sub-Saharan Africans | 0.1 /100 | #268 | Tragic 13.3% |
| Guyanese | 0.0 /100 | #269 | Tragic 13.3% |
| Cree | 0.0 /100 | #270 | Tragic 13.3% |
| Spanish Americans | 0.0 /100 | #271 | Tragic 13.4% |
| Immigrants | Bahamas | 0.0 /100 | #272 | Tragic 13.5% |
| Chickasaw | 0.0 /100 | #273 | Tragic 13.5% |