Trinidadian and Tobagonian vs Immigrants from Guyana Disability Age 65 to 74
COMPARE
Trinidadian and Tobagonian
Immigrants from Guyana
Disability Age 65 to 74
Disability Age 65 to 74 Comparison
Trinidadians and Tobagonians
Immigrants from Guyana
23.9%
DISABILITY AGE 65 TO 74
16.4/ 100
METRIC RATING
210th/ 347
METRIC RANK
23.6%
DISABILITY AGE 65 TO 74
31.2/ 100
METRIC RATING
190th/ 347
METRIC RANK
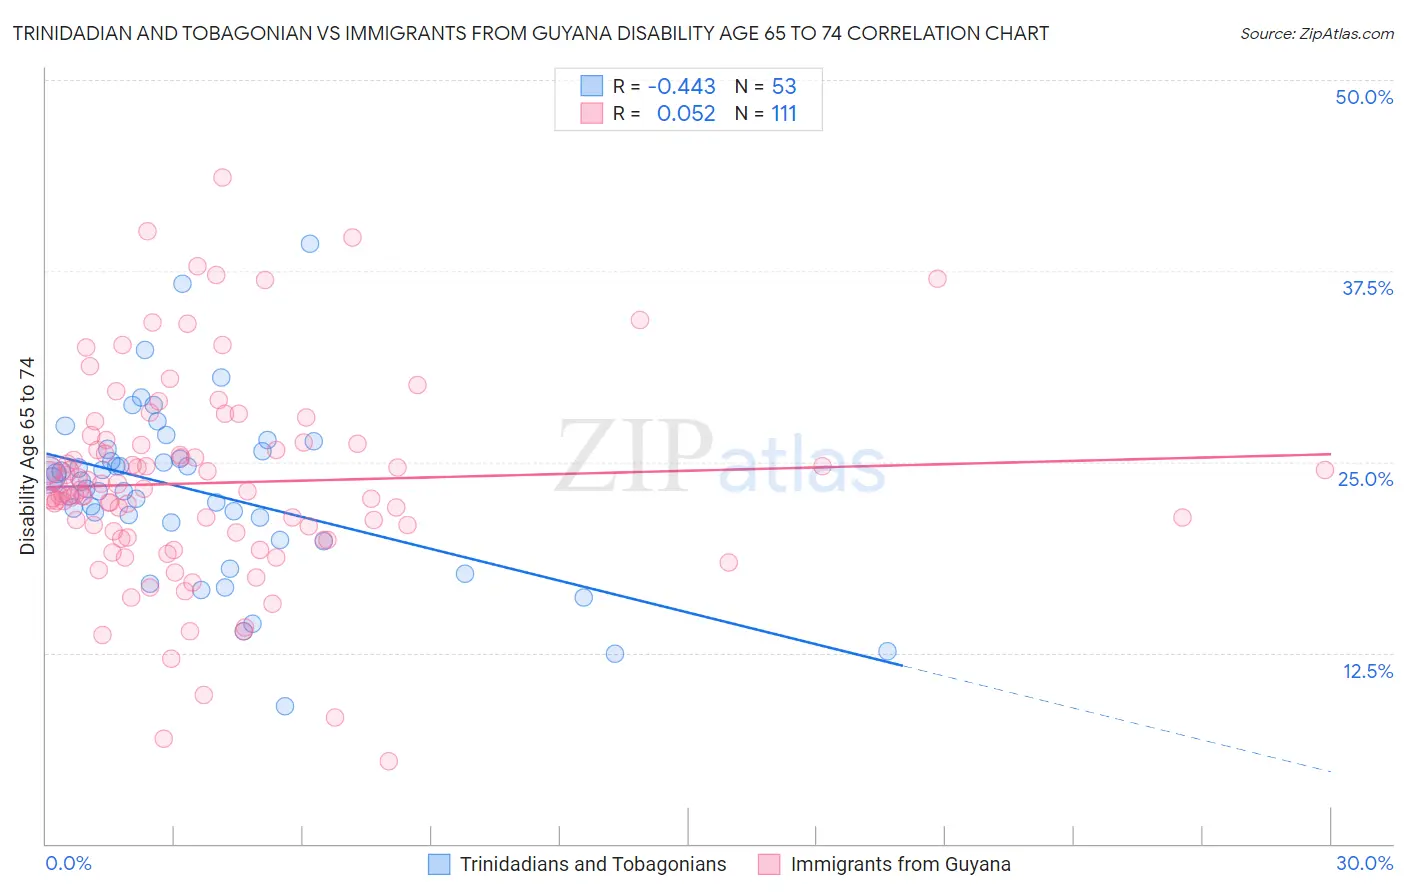
Trinidadian and Tobagonian vs Immigrants from Guyana Disability Age 65 to 74 Correlation Chart
The statistical analysis conducted on geographies consisting of 219,459,404 people shows a moderate negative correlation between the proportion of Trinidadians and Tobagonians and percentage of population with a disability between the ages 65 and 75 in the United States with a correlation coefficient (R) of -0.443 and weighted average of 23.9%. Similarly, the statistical analysis conducted on geographies consisting of 183,512,147 people shows a slight positive correlation between the proportion of Immigrants from Guyana and percentage of population with a disability between the ages 65 and 75 in the United States with a correlation coefficient (R) of 0.052 and weighted average of 23.6%, a difference of 1.2%.
Disability Age 65 to 74 Correlation Summary
| Measurement | Trinidadian and Tobagonian | Immigrants from Guyana |
| Minimum | 9.0% | 5.4% |
| Maximum | 39.2% | 43.6% |
| Range | 30.2% | 38.2% |
| Mean | 23.1% | 23.6% |
| Median | 23.7% | 23.1% |
| Interquartile 25% (IQ1) | 20.5% | 20.0% |
| Interquartile 75% (IQ3) | 25.8% | 26.2% |
| Interquartile Range (IQR) | 5.3% | 6.2% |
| Standard Deviation (Sample) | 5.6% | 6.7% |
| Standard Deviation (Population) | 5.6% | 6.6% |
Demographics Similar to Trinidadians and Tobagonians and Immigrants from Guyana by Disability Age 65 to 74
In terms of disability age 65 to 74, the demographic groups most similar to Trinidadians and Tobagonians are Immigrants from Barbados (23.8%, a difference of 0.31%), Immigrants from Kenya (23.8%, a difference of 0.31%), Immigrants from Sudan (23.8%, a difference of 0.35%), Tongan (23.8%, a difference of 0.41%), and Immigrants from Jamaica (23.8%, a difference of 0.41%). Similarly, the demographic groups most similar to Immigrants from Guyana are Immigrants from Bangladesh (23.6%, a difference of 0.070%), Ecuadorian (23.6%, a difference of 0.10%), English (23.6%, a difference of 0.19%), Sudanese (23.7%, a difference of 0.24%), and Immigrants from St. Vincent and the Grenadines (23.7%, a difference of 0.36%).
| Demographics | Rating | Rank | Disability Age 65 to 74 |
| Immigrants | Guyana | 31.2 /100 | #190 | Fair 23.6% |
| Immigrants | Bangladesh | 30.2 /100 | #191 | Fair 23.6% |
| Ecuadorians | 29.7 /100 | #192 | Fair 23.6% |
| English | 28.5 /100 | #193 | Fair 23.6% |
| Sudanese | 27.8 /100 | #194 | Fair 23.7% |
| Immigrants | St. Vincent and the Grenadines | 26.1 /100 | #195 | Fair 23.7% |
| Immigrants | Trinidad and Tobago | 26.1 /100 | #196 | Fair 23.7% |
| Immigrants | Immigrants | 25.8 /100 | #197 | Fair 23.7% |
| Immigrants | Africa | 24.4 /100 | #198 | Fair 23.7% |
| Welsh | 24.3 /100 | #199 | Fair 23.7% |
| French Canadians | 24.0 /100 | #200 | Fair 23.7% |
| Immigrants | Ecuador | 23.9 /100 | #201 | Fair 23.7% |
| Immigrants | Bahamas | 23.3 /100 | #202 | Fair 23.7% |
| Kenyans | 23.2 /100 | #203 | Fair 23.7% |
| Immigrants | Grenada | 22.1 /100 | #204 | Fair 23.8% |
| Tongans | 20.8 /100 | #205 | Fair 23.8% |
| Immigrants | Jamaica | 20.7 /100 | #206 | Fair 23.8% |
| Immigrants | Sudan | 20.1 /100 | #207 | Fair 23.8% |
| Immigrants | Barbados | 19.6 /100 | #208 | Poor 23.8% |
| Immigrants | Kenya | 19.6 /100 | #209 | Poor 23.8% |
| Trinidadians and Tobagonians | 16.4 /100 | #210 | Poor 23.9% |