Tohono O'odham vs Asian Female Disability
COMPARE
Tohono O'odham
Asian
Female Disability
Female Disability Comparison
Tohono O'odham
Asians
15.0%
FEMALE DISABILITY
0.0/ 100
METRIC RATING
337th/ 347
METRIC RANK
10.9%
FEMALE DISABILITY
100.0/ 100
METRIC RATING
21st/ 347
METRIC RANK
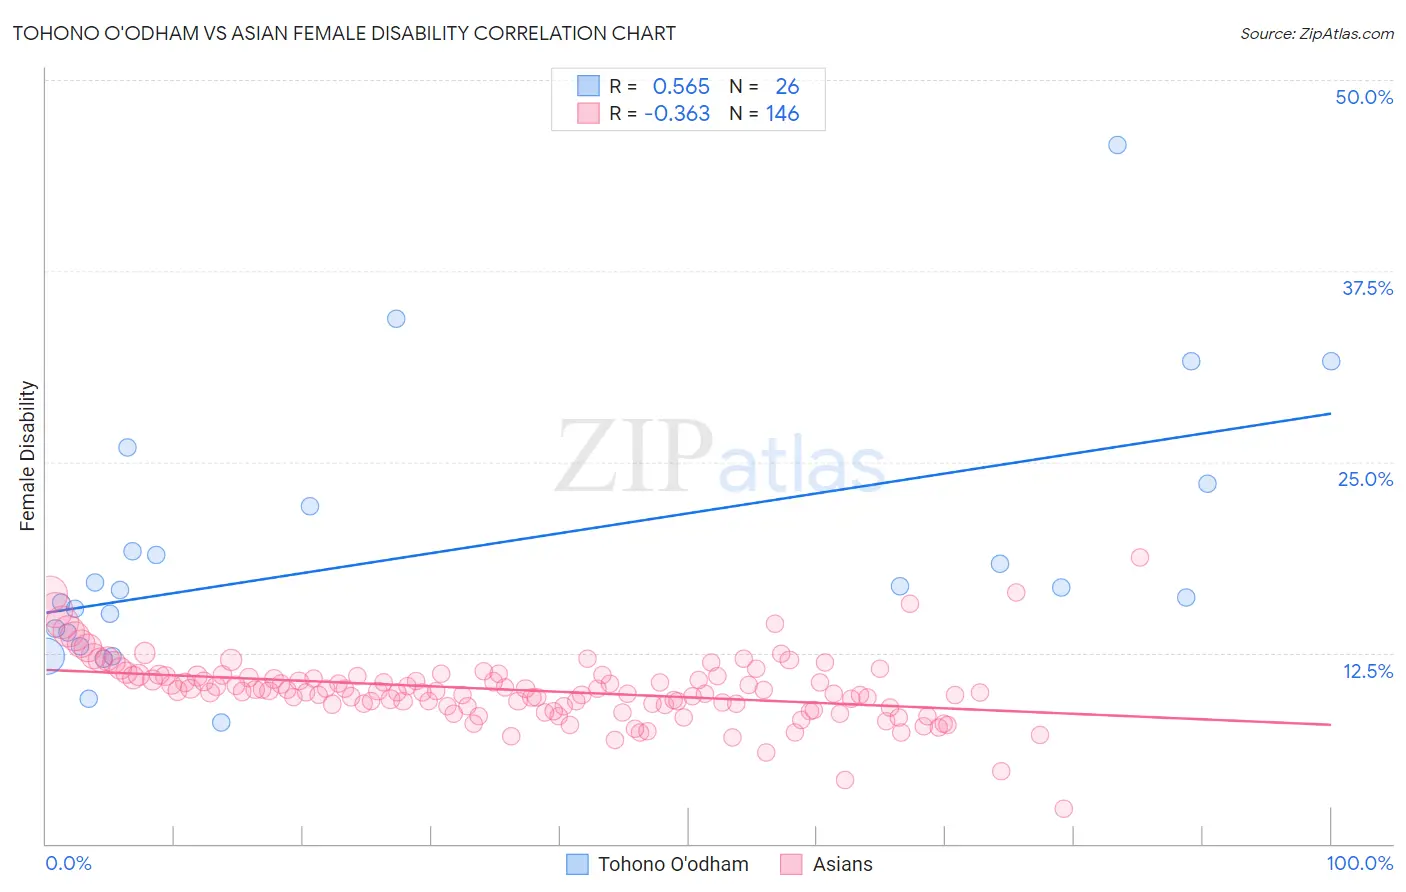
Tohono O'odham vs Asian Female Disability Correlation Chart
The statistical analysis conducted on geographies consisting of 58,717,428 people shows a substantial positive correlation between the proportion of Tohono O'odham and percentage of females with a disability in the United States with a correlation coefficient (R) of 0.565 and weighted average of 15.0%. Similarly, the statistical analysis conducted on geographies consisting of 550,713,500 people shows a mild negative correlation between the proportion of Asians and percentage of females with a disability in the United States with a correlation coefficient (R) of -0.363 and weighted average of 10.9%, a difference of 37.3%.
Female Disability Correlation Summary
| Measurement | Tohono O'odham | Asian |
| Minimum | 8.0% | 2.3% |
| Maximum | 45.8% | 18.7% |
| Range | 37.8% | 16.4% |
| Mean | 19.1% | 10.1% |
| Median | 16.7% | 10.0% |
| Interquartile 25% (IQ1) | 13.9% | 9.0% |
| Interquartile 75% (IQ3) | 22.1% | 11.0% |
| Interquartile Range (IQR) | 8.3% | 1.9% |
| Standard Deviation (Sample) | 8.6% | 2.2% |
| Standard Deviation (Population) | 8.4% | 2.1% |
Similar Demographics by Female Disability
Demographics Similar to Tohono O'odham by Female Disability
In terms of female disability, the demographic groups most similar to Tohono O'odham are Seminole (15.0%, a difference of 0.12%), Dutch West Indian (15.0%, a difference of 0.14%), Colville (15.1%, a difference of 0.55%), Cajun (14.9%, a difference of 0.80%), and Cherokee (14.9%, a difference of 0.82%).
| Demographics | Rating | Rank | Female Disability |
| Yuman | 0.0 /100 | #330 | Tragic 14.5% |
| Immigrants | Cabo Verde | 0.0 /100 | #331 | Tragic 14.6% |
| Pima | 0.0 /100 | #332 | Tragic 14.8% |
| Immigrants | Azores | 0.0 /100 | #333 | Tragic 14.9% |
| Cherokee | 0.0 /100 | #334 | Tragic 14.9% |
| Cajuns | 0.0 /100 | #335 | Tragic 14.9% |
| Seminole | 0.0 /100 | #336 | Tragic 15.0% |
| Tohono O'odham | 0.0 /100 | #337 | Tragic 15.0% |
| Dutch West Indians | 0.0 /100 | #338 | Tragic 15.0% |
| Colville | 0.0 /100 | #339 | Tragic 15.1% |
| Chickasaw | 0.0 /100 | #340 | Tragic 15.2% |
| Choctaw | 0.0 /100 | #341 | Tragic 15.4% |
| Creek | 0.0 /100 | #342 | Tragic 15.7% |
| Lumbee | 0.0 /100 | #343 | Tragic 15.8% |
| Kiowa | 0.0 /100 | #344 | Tragic 15.8% |
Demographics Similar to Asians by Female Disability
In terms of female disability, the demographic groups most similar to Asians are Immigrants from Sri Lanka (10.9%, a difference of 0.13%), Venezuelan (11.0%, a difference of 0.35%), Immigrants from Pakistan (10.9%, a difference of 0.36%), Immigrants from Venezuela (10.9%, a difference of 0.54%), and Immigrants from Iran (10.8%, a difference of 0.75%).
| Demographics | Rating | Rank | Female Disability |
| Immigrants | China | 100.0 /100 | #14 | Exceptional 10.7% |
| Burmese | 100.0 /100 | #15 | Exceptional 10.7% |
| Okinawans | 100.0 /100 | #16 | Exceptional 10.8% |
| Indians (Asian) | 100.0 /100 | #17 | Exceptional 10.8% |
| Immigrants | Iran | 100.0 /100 | #18 | Exceptional 10.8% |
| Immigrants | Venezuela | 100.0 /100 | #19 | Exceptional 10.9% |
| Immigrants | Pakistan | 100.0 /100 | #20 | Exceptional 10.9% |
| Asians | 100.0 /100 | #21 | Exceptional 10.9% |
| Immigrants | Sri Lanka | 100.0 /100 | #22 | Exceptional 10.9% |
| Venezuelans | 100.0 /100 | #23 | Exceptional 11.0% |
| Immigrants | Argentina | 100.0 /100 | #24 | Exceptional 11.0% |
| Immigrants | Asia | 100.0 /100 | #25 | Exceptional 11.0% |
| Argentineans | 100.0 /100 | #26 | Exceptional 11.0% |
| Immigrants | Turkey | 100.0 /100 | #27 | Exceptional 11.1% |
| Egyptians | 100.0 /100 | #28 | Exceptional 11.1% |