Tohono O'odham vs Immigrants from Yemen Female Disability
COMPARE
Tohono O'odham
Immigrants from Yemen
Female Disability
Female Disability Comparison
Tohono O'odham
Immigrants from Yemen
15.0%
FEMALE DISABILITY
0.0/ 100
METRIC RATING
337th/ 347
METRIC RANK
13.2%
FEMALE DISABILITY
0.0/ 100
METRIC RATING
290th/ 347
METRIC RANK
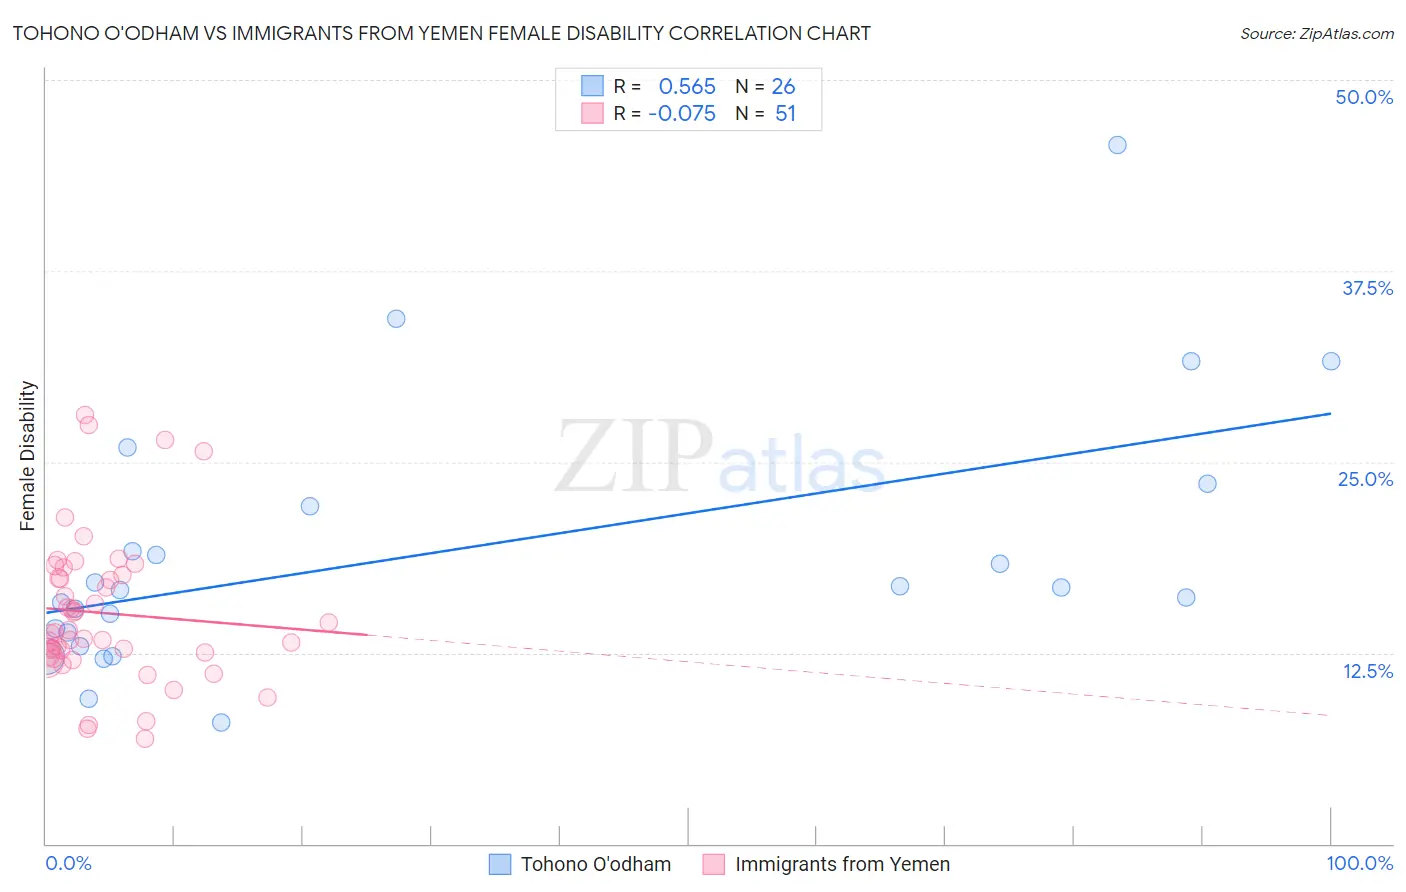
Tohono O'odham vs Immigrants from Yemen Female Disability Correlation Chart
The statistical analysis conducted on geographies consisting of 58,717,428 people shows a substantial positive correlation between the proportion of Tohono O'odham and percentage of females with a disability in the United States with a correlation coefficient (R) of 0.565 and weighted average of 15.0%. Similarly, the statistical analysis conducted on geographies consisting of 82,433,611 people shows a slight negative correlation between the proportion of Immigrants from Yemen and percentage of females with a disability in the United States with a correlation coefficient (R) of -0.075 and weighted average of 13.2%, a difference of 13.5%.
Female Disability Correlation Summary
| Measurement | Tohono O'odham | Immigrants from Yemen |
| Minimum | 8.0% | 6.9% |
| Maximum | 45.8% | 28.1% |
| Range | 37.8% | 21.2% |
| Mean | 19.1% | 15.1% |
| Median | 16.7% | 13.9% |
| Interquartile 25% (IQ1) | 13.9% | 12.4% |
| Interquartile 75% (IQ3) | 22.1% | 17.6% |
| Interquartile Range (IQR) | 8.3% | 5.2% |
| Standard Deviation (Sample) | 8.6% | 4.8% |
| Standard Deviation (Population) | 8.4% | 4.7% |
Similar Demographics by Female Disability
Demographics Similar to Tohono O'odham by Female Disability
In terms of female disability, the demographic groups most similar to Tohono O'odham are Seminole (15.0%, a difference of 0.12%), Dutch West Indian (15.0%, a difference of 0.14%), Colville (15.1%, a difference of 0.55%), Cajun (14.9%, a difference of 0.80%), and Cherokee (14.9%, a difference of 0.82%).
| Demographics | Rating | Rank | Female Disability |
| Yuman | 0.0 /100 | #330 | Tragic 14.5% |
| Immigrants | Cabo Verde | 0.0 /100 | #331 | Tragic 14.6% |
| Pima | 0.0 /100 | #332 | Tragic 14.8% |
| Immigrants | Azores | 0.0 /100 | #333 | Tragic 14.9% |
| Cherokee | 0.0 /100 | #334 | Tragic 14.9% |
| Cajuns | 0.0 /100 | #335 | Tragic 14.9% |
| Seminole | 0.0 /100 | #336 | Tragic 15.0% |
| Tohono O'odham | 0.0 /100 | #337 | Tragic 15.0% |
| Dutch West Indians | 0.0 /100 | #338 | Tragic 15.0% |
| Colville | 0.0 /100 | #339 | Tragic 15.1% |
| Chickasaw | 0.0 /100 | #340 | Tragic 15.2% |
| Choctaw | 0.0 /100 | #341 | Tragic 15.4% |
| Creek | 0.0 /100 | #342 | Tragic 15.7% |
| Lumbee | 0.0 /100 | #343 | Tragic 15.8% |
| Kiowa | 0.0 /100 | #344 | Tragic 15.8% |
Demographics Similar to Immigrants from Yemen by Female Disability
In terms of female disability, the demographic groups most similar to Immigrants from Yemen are Tlingit-Haida (13.2%, a difference of 0.0%), Shoshone (13.2%, a difference of 0.060%), White/Caucasian (13.2%, a difference of 0.18%), Yakama (13.2%, a difference of 0.23%), and Yaqui (13.2%, a difference of 0.27%).
| Demographics | Rating | Rank | Female Disability |
| English | 0.0 /100 | #283 | Tragic 13.1% |
| Hmong | 0.0 /100 | #284 | Tragic 13.1% |
| Bangladeshis | 0.0 /100 | #285 | Tragic 13.1% |
| Fijians | 0.0 /100 | #286 | Tragic 13.1% |
| Yaqui | 0.0 /100 | #287 | Tragic 13.2% |
| Whites/Caucasians | 0.0 /100 | #288 | Tragic 13.2% |
| Tlingit-Haida | 0.0 /100 | #289 | Tragic 13.2% |
| Immigrants | Yemen | 0.0 /100 | #290 | Tragic 13.2% |
| Shoshone | 0.0 /100 | #291 | Tragic 13.2% |
| Yakama | 0.0 /100 | #292 | Tragic 13.2% |
| Marshallese | 0.0 /100 | #293 | Tragic 13.3% |
| Celtics | 0.0 /100 | #294 | Tragic 13.3% |
| French | 0.0 /100 | #295 | Tragic 13.3% |
| Nepalese | 0.0 /100 | #296 | Tragic 13.3% |
| Slovaks | 0.0 /100 | #297 | Tragic 13.3% |