Soviet Union vs Spanish Disability Age 65 to 74
COMPARE
Soviet Union
Spanish
Disability Age 65 to 74
Disability Age 65 to 74 Comparison
Soviet Union
Spanish
21.0%
DISABILITY AGE 65 TO 74
99.9/ 100
METRIC RATING
24th/ 347
METRIC RANK
24.6%
DISABILITY AGE 65 TO 74
2.2/ 100
METRIC RATING
243rd/ 347
METRIC RANK
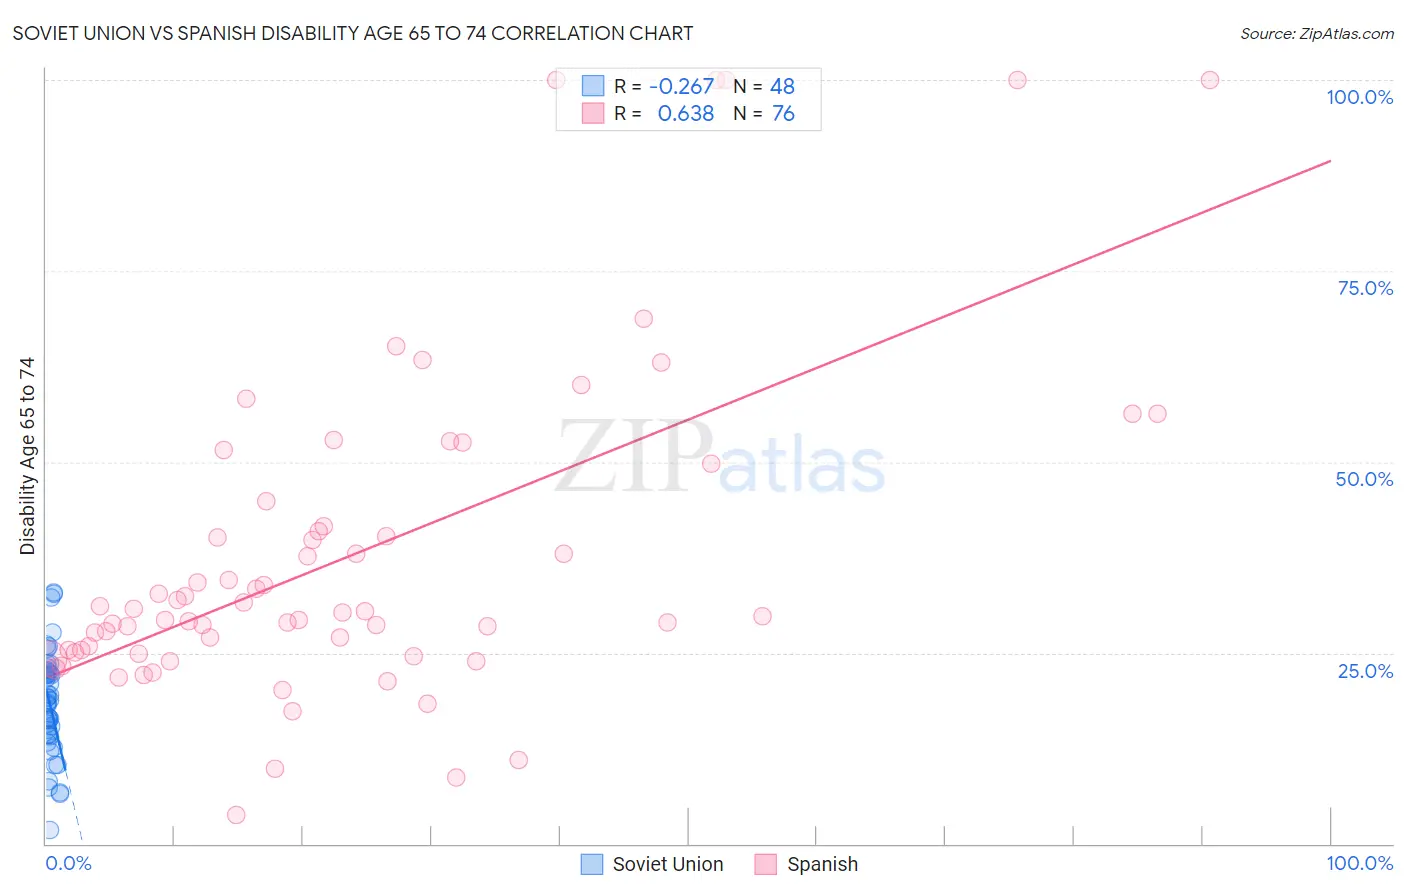
Soviet Union vs Spanish Disability Age 65 to 74 Correlation Chart
The statistical analysis conducted on geographies consisting of 43,509,359 people shows a weak negative correlation between the proportion of Soviet Union and percentage of population with a disability between the ages 65 and 75 in the United States with a correlation coefficient (R) of -0.267 and weighted average of 21.0%. Similarly, the statistical analysis conducted on geographies consisting of 421,397,918 people shows a significant positive correlation between the proportion of Spanish and percentage of population with a disability between the ages 65 and 75 in the United States with a correlation coefficient (R) of 0.638 and weighted average of 24.6%, a difference of 17.5%.
Disability Age 65 to 74 Correlation Summary
| Measurement | Soviet Union | Spanish |
| Minimum | 1.8% | 3.8% |
| Maximum | 32.9% | 100.0% |
| Range | 31.0% | 96.2% |
| Mean | 18.4% | 37.8% |
| Median | 18.7% | 30.4% |
| Interquartile 25% (IQ1) | 14.3% | 25.2% |
| Interquartile 75% (IQ3) | 22.4% | 43.2% |
| Interquartile Range (IQR) | 8.2% | 18.0% |
| Standard Deviation (Sample) | 6.8% | 21.4% |
| Standard Deviation (Population) | 6.7% | 21.2% |
Similar Demographics by Disability Age 65 to 74
Demographics Similar to Soviet Union by Disability Age 65 to 74
In terms of disability age 65 to 74, the demographic groups most similar to Soviet Union are Bolivian (21.0%, a difference of 0.040%), Immigrants from Belgium (21.0%, a difference of 0.050%), Immigrants from Australia (21.0%, a difference of 0.060%), Immigrants from Sweden (21.0%, a difference of 0.080%), and Immigrants from Czechoslovakia (21.0%, a difference of 0.18%).
| Demographics | Rating | Rank | Disability Age 65 to 74 |
| Immigrants | South Central Asia | 100.0 /100 | #17 | Exceptional 20.6% |
| Eastern Europeans | 100.0 /100 | #18 | Exceptional 20.6% |
| Burmese | 100.0 /100 | #19 | Exceptional 20.6% |
| Okinawans | 100.0 /100 | #20 | Exceptional 20.7% |
| Immigrants | Bolivia | 99.9 /100 | #21 | Exceptional 20.8% |
| Immigrants | Iran | 99.9 /100 | #22 | Exceptional 20.9% |
| Immigrants | Belgium | 99.9 /100 | #23 | Exceptional 21.0% |
| Soviet Union | 99.9 /100 | #24 | Exceptional 21.0% |
| Bolivians | 99.9 /100 | #25 | Exceptional 21.0% |
| Immigrants | Australia | 99.9 /100 | #26 | Exceptional 21.0% |
| Immigrants | Sweden | 99.9 /100 | #27 | Exceptional 21.0% |
| Immigrants | Czechoslovakia | 99.9 /100 | #28 | Exceptional 21.0% |
| Immigrants | Japan | 99.9 /100 | #29 | Exceptional 21.0% |
| Immigrants | Greece | 99.9 /100 | #30 | Exceptional 21.0% |
| Immigrants | Northern Europe | 99.9 /100 | #31 | Exceptional 21.0% |
Demographics Similar to Spanish by Disability Age 65 to 74
In terms of disability age 65 to 74, the demographic groups most similar to Spanish are Immigrants from Senegal (24.6%, a difference of 0.010%), Immigrants from Western Africa (24.6%, a difference of 0.090%), Armenian (24.7%, a difference of 0.12%), British West Indian (24.7%, a difference of 0.13%), and Spaniard (24.6%, a difference of 0.18%).
| Demographics | Rating | Rank | Disability Age 65 to 74 |
| German Russians | 3.7 /100 | #236 | Tragic 24.4% |
| West Indians | 3.4 /100 | #237 | Tragic 24.5% |
| Immigrants | Ghana | 3.0 /100 | #238 | Tragic 24.5% |
| Immigrants | Caribbean | 2.6 /100 | #239 | Tragic 24.6% |
| Spaniards | 2.4 /100 | #240 | Tragic 24.6% |
| Immigrants | Western Africa | 2.3 /100 | #241 | Tragic 24.6% |
| Immigrants | Senegal | 2.2 /100 | #242 | Tragic 24.6% |
| Spanish | 2.2 /100 | #243 | Tragic 24.6% |
| Armenians | 2.0 /100 | #244 | Tragic 24.7% |
| British West Indians | 2.0 /100 | #245 | Tragic 24.7% |
| Immigrants | Iraq | 1.9 /100 | #246 | Tragic 24.7% |
| Indonesians | 1.1 /100 | #247 | Tragic 24.9% |
| Senegalese | 0.9 /100 | #248 | Tragic 24.9% |
| Immigrants | Fiji | 0.8 /100 | #249 | Tragic 25.0% |
| Salvadorans | 0.8 /100 | #250 | Tragic 25.0% |