Venezuelan vs Spanish Disability Age 65 to 74
COMPARE
Venezuelan
Spanish
Disability Age 65 to 74
Disability Age 65 to 74 Comparison
Venezuelans
Spanish
21.8%
DISABILITY AGE 65 TO 74
99.0/ 100
METRIC RATING
79th/ 347
METRIC RANK
24.6%
DISABILITY AGE 65 TO 74
2.2/ 100
METRIC RATING
243rd/ 347
METRIC RANK
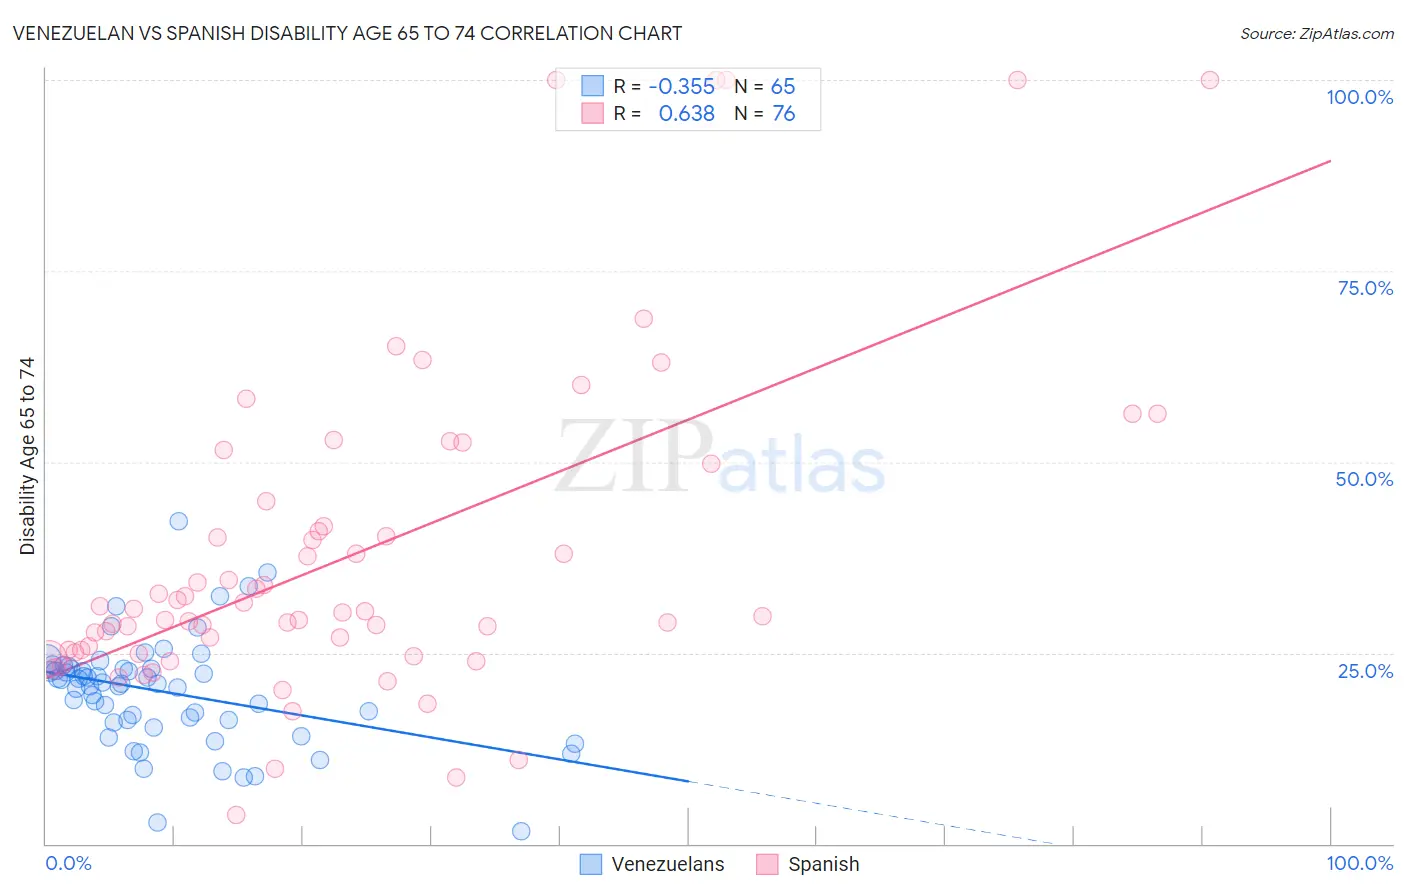
Venezuelan vs Spanish Disability Age 65 to 74 Correlation Chart
The statistical analysis conducted on geographies consisting of 305,747,321 people shows a mild negative correlation between the proportion of Venezuelans and percentage of population with a disability between the ages 65 and 75 in the United States with a correlation coefficient (R) of -0.355 and weighted average of 21.8%. Similarly, the statistical analysis conducted on geographies consisting of 421,397,918 people shows a significant positive correlation between the proportion of Spanish and percentage of population with a disability between the ages 65 and 75 in the United States with a correlation coefficient (R) of 0.638 and weighted average of 24.6%, a difference of 13.0%.
Disability Age 65 to 74 Correlation Summary
| Measurement | Venezuelan | Spanish |
| Minimum | 1.6% | 3.8% |
| Maximum | 42.3% | 100.0% |
| Range | 40.7% | 96.2% |
| Mean | 19.9% | 37.8% |
| Median | 20.9% | 30.4% |
| Interquartile 25% (IQ1) | 16.1% | 25.2% |
| Interquartile 75% (IQ3) | 22.9% | 43.2% |
| Interquartile Range (IQR) | 6.9% | 18.0% |
| Standard Deviation (Sample) | 7.1% | 21.4% |
| Standard Deviation (Population) | 7.0% | 21.2% |
Similar Demographics by Disability Age 65 to 74
Demographics Similar to Venezuelans by Disability Age 65 to 74
In terms of disability age 65 to 74, the demographic groups most similar to Venezuelans are Immigrants from Eastern Europe (21.8%, a difference of 0.0%), Immigrants from Norway (21.8%, a difference of 0.010%), Immigrants from Poland (21.8%, a difference of 0.060%), Croatian (21.8%, a difference of 0.080%), and Greek (21.8%, a difference of 0.12%).
| Demographics | Rating | Rank | Disability Age 65 to 74 |
| Immigrants | Hungary | 99.2 /100 | #72 | Exceptional 21.7% |
| Immigrants | Venezuela | 99.0 /100 | #73 | Exceptional 21.8% |
| Cambodians | 99.0 /100 | #74 | Exceptional 21.8% |
| Mongolians | 99.0 /100 | #75 | Exceptional 21.8% |
| Greeks | 99.0 /100 | #76 | Exceptional 21.8% |
| Immigrants | Poland | 99.0 /100 | #77 | Exceptional 21.8% |
| Immigrants | Eastern Europe | 99.0 /100 | #78 | Exceptional 21.8% |
| Venezuelans | 99.0 /100 | #79 | Exceptional 21.8% |
| Immigrants | Norway | 98.9 /100 | #80 | Exceptional 21.8% |
| Croatians | 98.9 /100 | #81 | Exceptional 21.8% |
| Immigrants | Indonesia | 98.7 /100 | #82 | Exceptional 21.9% |
| Immigrants | Brazil | 98.5 /100 | #83 | Exceptional 21.9% |
| Immigrants | Spain | 98.5 /100 | #84 | Exceptional 21.9% |
| Immigrants | Lebanon | 98.4 /100 | #85 | Exceptional 21.9% |
| South Africans | 98.4 /100 | #86 | Exceptional 21.9% |
Demographics Similar to Spanish by Disability Age 65 to 74
In terms of disability age 65 to 74, the demographic groups most similar to Spanish are Immigrants from Senegal (24.6%, a difference of 0.010%), Immigrants from Western Africa (24.6%, a difference of 0.090%), Armenian (24.7%, a difference of 0.12%), British West Indian (24.7%, a difference of 0.13%), and Spaniard (24.6%, a difference of 0.18%).
| Demographics | Rating | Rank | Disability Age 65 to 74 |
| German Russians | 3.7 /100 | #236 | Tragic 24.4% |
| West Indians | 3.4 /100 | #237 | Tragic 24.5% |
| Immigrants | Ghana | 3.0 /100 | #238 | Tragic 24.5% |
| Immigrants | Caribbean | 2.6 /100 | #239 | Tragic 24.6% |
| Spaniards | 2.4 /100 | #240 | Tragic 24.6% |
| Immigrants | Western Africa | 2.3 /100 | #241 | Tragic 24.6% |
| Immigrants | Senegal | 2.2 /100 | #242 | Tragic 24.6% |
| Spanish | 2.2 /100 | #243 | Tragic 24.6% |
| Armenians | 2.0 /100 | #244 | Tragic 24.7% |
| British West Indians | 2.0 /100 | #245 | Tragic 24.7% |
| Immigrants | Iraq | 1.9 /100 | #246 | Tragic 24.7% |
| Indonesians | 1.1 /100 | #247 | Tragic 24.9% |
| Senegalese | 0.9 /100 | #248 | Tragic 24.9% |
| Immigrants | Fiji | 0.8 /100 | #249 | Tragic 25.0% |
| Salvadorans | 0.8 /100 | #250 | Tragic 25.0% |