Assyrian/Chaldean/Syriac vs Spanish Disability Age 65 to 74
COMPARE
Assyrian/Chaldean/Syriac
Spanish
Disability Age 65 to 74
Disability Age 65 to 74 Comparison
Assyrians/Chaldeans/Syriacs
Spanish
23.4%
DISABILITY AGE 65 TO 74
45.3/ 100
METRIC RATING
181st/ 347
METRIC RANK
24.6%
DISABILITY AGE 65 TO 74
2.2/ 100
METRIC RATING
243rd/ 347
METRIC RANK
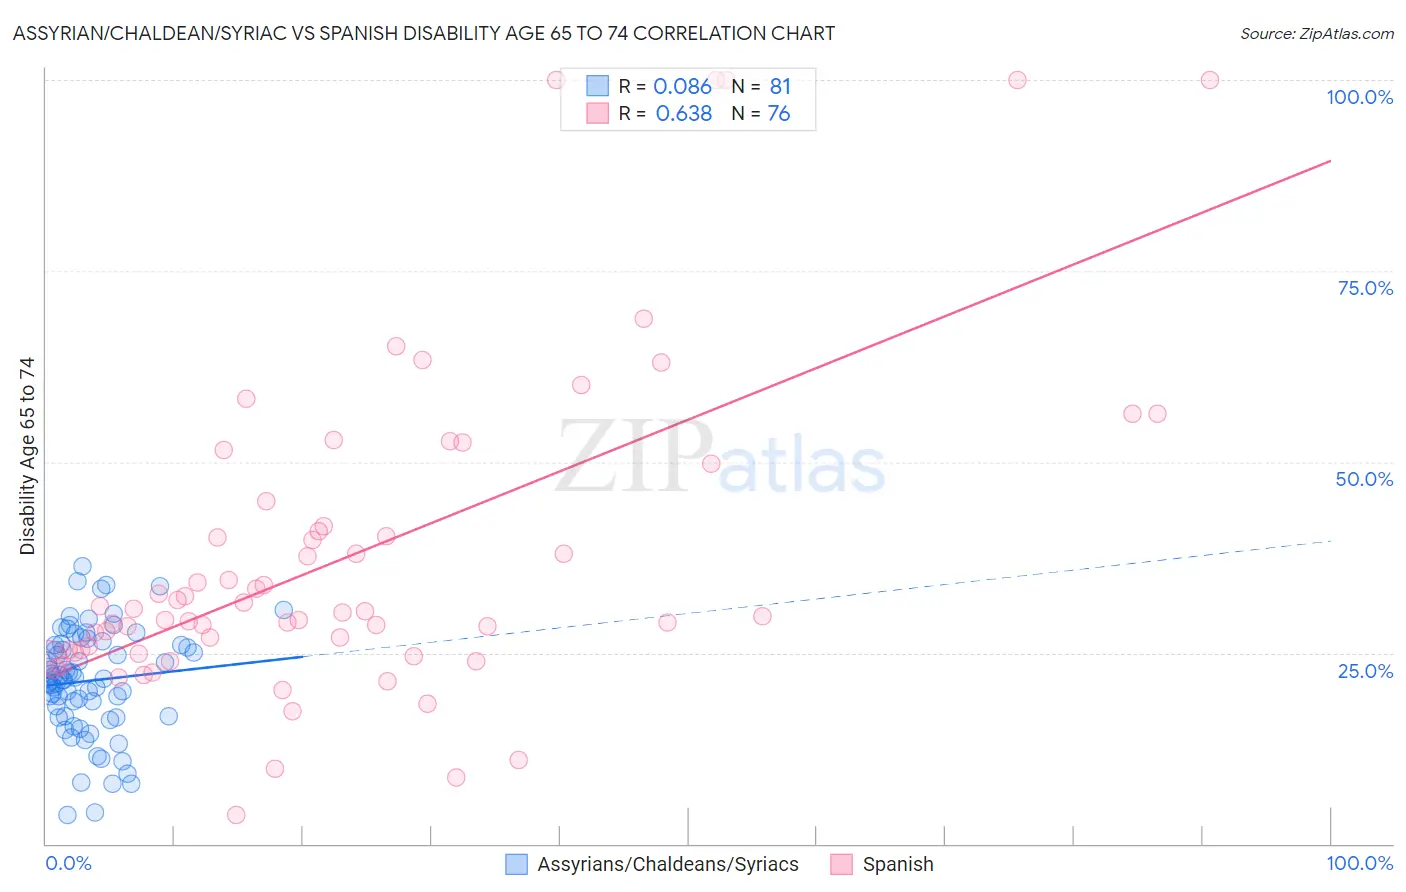
Assyrian/Chaldean/Syriac vs Spanish Disability Age 65 to 74 Correlation Chart
The statistical analysis conducted on geographies consisting of 110,230,384 people shows a slight positive correlation between the proportion of Assyrians/Chaldeans/Syriacs and percentage of population with a disability between the ages 65 and 75 in the United States with a correlation coefficient (R) of 0.086 and weighted average of 23.4%. Similarly, the statistical analysis conducted on geographies consisting of 421,397,918 people shows a significant positive correlation between the proportion of Spanish and percentage of population with a disability between the ages 65 and 75 in the United States with a correlation coefficient (R) of 0.638 and weighted average of 24.6%, a difference of 5.3%.
Disability Age 65 to 74 Correlation Summary
| Measurement | Assyrian/Chaldean/Syriac | Spanish |
| Minimum | 3.8% | 3.8% |
| Maximum | 36.4% | 100.0% |
| Range | 32.6% | 96.2% |
| Mean | 21.3% | 37.8% |
| Median | 21.7% | 30.4% |
| Interquartile 25% (IQ1) | 16.7% | 25.2% |
| Interquartile 75% (IQ3) | 26.1% | 43.2% |
| Interquartile Range (IQR) | 9.4% | 18.0% |
| Standard Deviation (Sample) | 7.0% | 21.4% |
| Standard Deviation (Population) | 6.9% | 21.2% |
Similar Demographics by Disability Age 65 to 74
Demographics Similar to Assyrians/Chaldeans/Syriacs by Disability Age 65 to 74
In terms of disability age 65 to 74, the demographic groups most similar to Assyrians/Chaldeans/Syriacs are Scandinavian (23.4%, a difference of 0.010%), Guyanese (23.4%, a difference of 0.030%), Immigrants from Sierra Leone (23.4%, a difference of 0.030%), Irish (23.4%, a difference of 0.060%), and Immigrants from Eritrea (23.4%, a difference of 0.13%).
| Demographics | Rating | Rank | Disability Age 65 to 74 |
| Immigrants | South Eastern Asia | 50.0 /100 | #174 | Average 23.3% |
| Dutch | 49.4 /100 | #175 | Average 23.3% |
| Immigrants | Eritrea | 47.5 /100 | #176 | Average 23.4% |
| Immigrants | Haiti | 47.5 /100 | #177 | Average 23.4% |
| Guyanese | 45.8 /100 | #178 | Average 23.4% |
| Immigrants | Sierra Leone | 45.8 /100 | #179 | Average 23.4% |
| Scandinavians | 45.6 /100 | #180 | Average 23.4% |
| Assyrians/Chaldeans/Syriacs | 45.3 /100 | #181 | Average 23.4% |
| Irish | 44.4 /100 | #182 | Average 23.4% |
| Immigrants | Eastern Africa | 42.8 /100 | #183 | Average 23.4% |
| Immigrants | Germany | 42.5 /100 | #184 | Average 23.4% |
| Haitians | 42.4 /100 | #185 | Average 23.4% |
| Basques | 38.4 /100 | #186 | Fair 23.5% |
| Portuguese | 37.8 /100 | #187 | Fair 23.5% |
| Immigrants | Cuba | 34.0 /100 | #188 | Fair 23.6% |
Demographics Similar to Spanish by Disability Age 65 to 74
In terms of disability age 65 to 74, the demographic groups most similar to Spanish are Immigrants from Senegal (24.6%, a difference of 0.010%), Immigrants from Western Africa (24.6%, a difference of 0.090%), Armenian (24.7%, a difference of 0.12%), British West Indian (24.7%, a difference of 0.13%), and Spaniard (24.6%, a difference of 0.18%).
| Demographics | Rating | Rank | Disability Age 65 to 74 |
| German Russians | 3.7 /100 | #236 | Tragic 24.4% |
| West Indians | 3.4 /100 | #237 | Tragic 24.5% |
| Immigrants | Ghana | 3.0 /100 | #238 | Tragic 24.5% |
| Immigrants | Caribbean | 2.6 /100 | #239 | Tragic 24.6% |
| Spaniards | 2.4 /100 | #240 | Tragic 24.6% |
| Immigrants | Western Africa | 2.3 /100 | #241 | Tragic 24.6% |
| Immigrants | Senegal | 2.2 /100 | #242 | Tragic 24.6% |
| Spanish | 2.2 /100 | #243 | Tragic 24.6% |
| Armenians | 2.0 /100 | #244 | Tragic 24.7% |
| British West Indians | 2.0 /100 | #245 | Tragic 24.7% |
| Immigrants | Iraq | 1.9 /100 | #246 | Tragic 24.7% |
| Indonesians | 1.1 /100 | #247 | Tragic 24.9% |
| Senegalese | 0.9 /100 | #248 | Tragic 24.9% |
| Immigrants | Fiji | 0.8 /100 | #249 | Tragic 25.0% |
| Salvadorans | 0.8 /100 | #250 | Tragic 25.0% |