Ethiopian vs Immigrants from Belarus Male Disability
COMPARE
Ethiopian
Immigrants from Belarus
Male Disability
Male Disability Comparison
Ethiopians
Immigrants from Belarus
10.2%
MALE DISABILITY
99.8/ 100
METRIC RATING
36th/ 347
METRIC RANK
10.4%
MALE DISABILITY
99.3/ 100
METRIC RATING
63rd/ 347
METRIC RANK
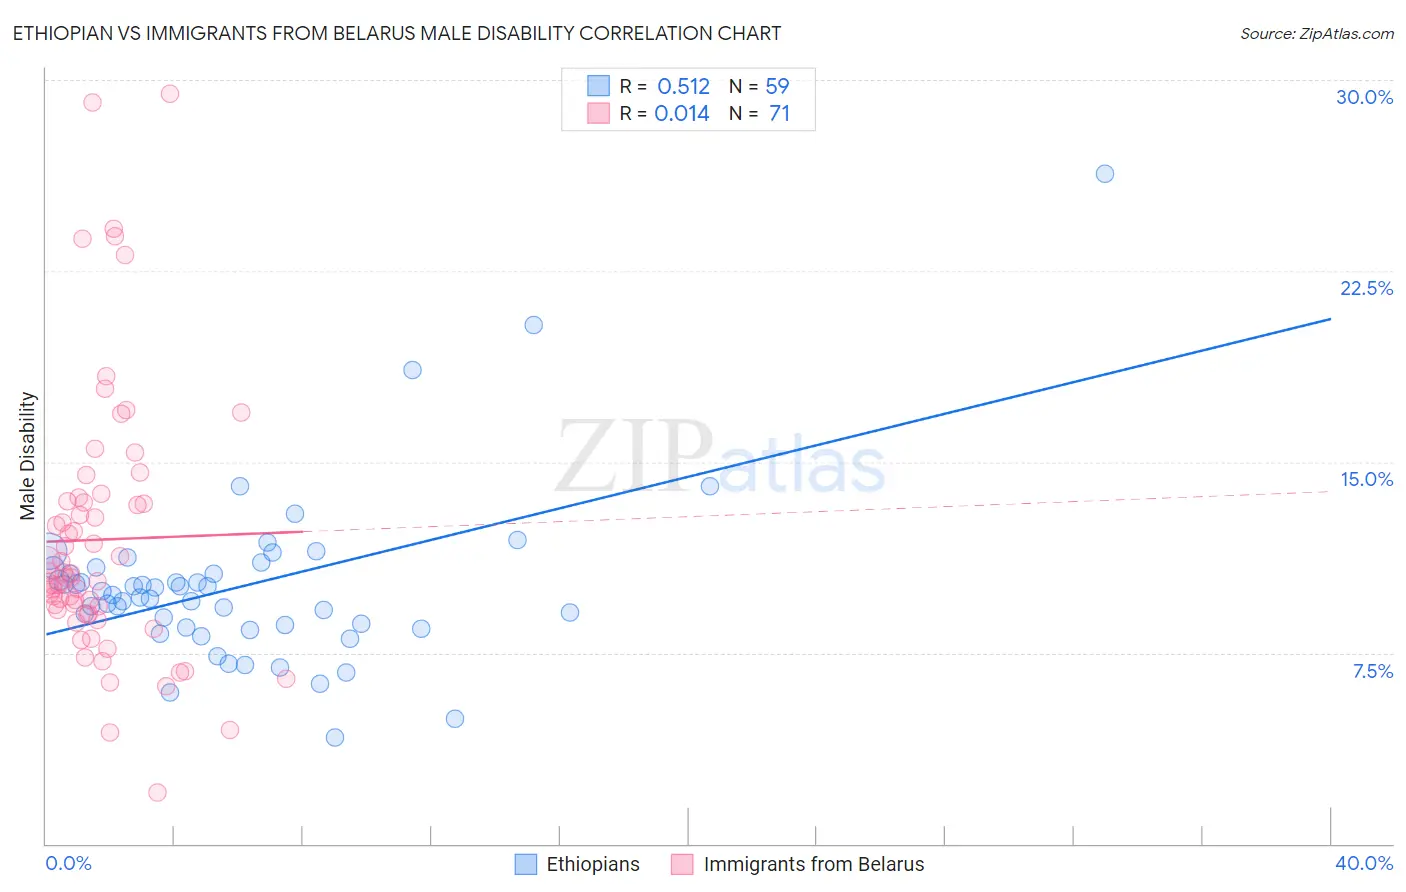
Ethiopian vs Immigrants from Belarus Male Disability Correlation Chart
The statistical analysis conducted on geographies consisting of 223,232,754 people shows a substantial positive correlation between the proportion of Ethiopians and percentage of males with a disability in the United States with a correlation coefficient (R) of 0.512 and weighted average of 10.2%. Similarly, the statistical analysis conducted on geographies consisting of 150,193,333 people shows no correlation between the proportion of Immigrants from Belarus and percentage of males with a disability in the United States with a correlation coefficient (R) of 0.014 and weighted average of 10.4%, a difference of 2.3%.
Male Disability Correlation Summary
| Measurement | Ethiopian | Immigrants from Belarus |
| Minimum | 4.2% | 2.0% |
| Maximum | 26.3% | 29.5% |
| Range | 22.2% | 27.4% |
| Mean | 10.1% | 11.9% |
| Median | 9.8% | 10.5% |
| Interquartile 25% (IQ1) | 8.5% | 9.0% |
| Interquartile 75% (IQ3) | 10.8% | 13.5% |
| Interquartile Range (IQR) | 2.3% | 4.4% |
| Standard Deviation (Sample) | 3.4% | 5.3% |
| Standard Deviation (Population) | 3.4% | 5.2% |
Similar Demographics by Male Disability
Demographics Similar to Ethiopians by Male Disability
In terms of male disability, the demographic groups most similar to Ethiopians are Immigrants from Argentina (10.2%, a difference of 0.050%), Immigrants from Indonesia (10.2%, a difference of 0.070%), Immigrants from Turkey (10.2%, a difference of 0.16%), Immigrants from Ethiopia (10.2%, a difference of 0.22%), and Immigrants from Kuwait (10.2%, a difference of 0.24%).
| Demographics | Rating | Rank | Male Disability |
| Venezuelans | 99.9 /100 | #29 | Exceptional 10.1% |
| Immigrants | Egypt | 99.9 /100 | #30 | Exceptional 10.1% |
| Soviet Union | 99.9 /100 | #31 | Exceptional 10.1% |
| Argentineans | 99.9 /100 | #32 | Exceptional 10.1% |
| Immigrants | Ethiopia | 99.9 /100 | #33 | Exceptional 10.2% |
| Immigrants | Turkey | 99.9 /100 | #34 | Exceptional 10.2% |
| Immigrants | Argentina | 99.9 /100 | #35 | Exceptional 10.2% |
| Ethiopians | 99.8 /100 | #36 | Exceptional 10.2% |
| Immigrants | Indonesia | 99.8 /100 | #37 | Exceptional 10.2% |
| Immigrants | Kuwait | 99.8 /100 | #38 | Exceptional 10.2% |
| Afghans | 99.8 /100 | #39 | Exceptional 10.2% |
| Immigrants | Nepal | 99.8 /100 | #40 | Exceptional 10.3% |
| Taiwanese | 99.8 /100 | #41 | Exceptional 10.3% |
| Mongolians | 99.7 /100 | #42 | Exceptional 10.3% |
| Immigrants | Bangladesh | 99.7 /100 | #43 | Exceptional 10.3% |
Demographics Similar to Immigrants from Belarus by Male Disability
In terms of male disability, the demographic groups most similar to Immigrants from Belarus are Immigrants from Ecuador (10.4%, a difference of 0.020%), Jordanian (10.5%, a difference of 0.12%), Immigrants from Grenada (10.5%, a difference of 0.15%), Guyanese (10.5%, a difference of 0.15%), and Immigrants from Afghanistan (10.5%, a difference of 0.16%).
| Demographics | Rating | Rank | Male Disability |
| Tongans | 99.6 /100 | #56 | Exceptional 10.4% |
| Immigrants | South America | 99.6 /100 | #57 | Exceptional 10.4% |
| Immigrants | Japan | 99.5 /100 | #58 | Exceptional 10.4% |
| Immigrants | Australia | 99.5 /100 | #59 | Exceptional 10.4% |
| Immigrants | Colombia | 99.5 /100 | #60 | Exceptional 10.4% |
| Immigrants | Northern Africa | 99.4 /100 | #61 | Exceptional 10.4% |
| Immigrants | Ecuador | 99.3 /100 | #62 | Exceptional 10.4% |
| Immigrants | Belarus | 99.3 /100 | #63 | Exceptional 10.4% |
| Jordanians | 99.3 /100 | #64 | Exceptional 10.5% |
| Immigrants | Grenada | 99.2 /100 | #65 | Exceptional 10.5% |
| Guyanese | 99.2 /100 | #66 | Exceptional 10.5% |
| Immigrants | Afghanistan | 99.2 /100 | #67 | Exceptional 10.5% |
| Colombians | 99.2 /100 | #68 | Exceptional 10.5% |
| Ecuadorians | 99.2 /100 | #69 | Exceptional 10.5% |
| Immigrants | Bulgaria | 99.1 /100 | #70 | Exceptional 10.5% |