Swiss vs Immigrants from Colombia Hearing Disability
COMPARE
Swiss
Immigrants from Colombia
Hearing Disability
Hearing Disability Comparison
Swiss
Immigrants from Colombia
3.5%
HEARING DISABILITY
0.0/ 100
METRIC RATING
274th/ 347
METRIC RANK
2.7%
HEARING DISABILITY
98.4/ 100
METRIC RATING
62nd/ 347
METRIC RANK
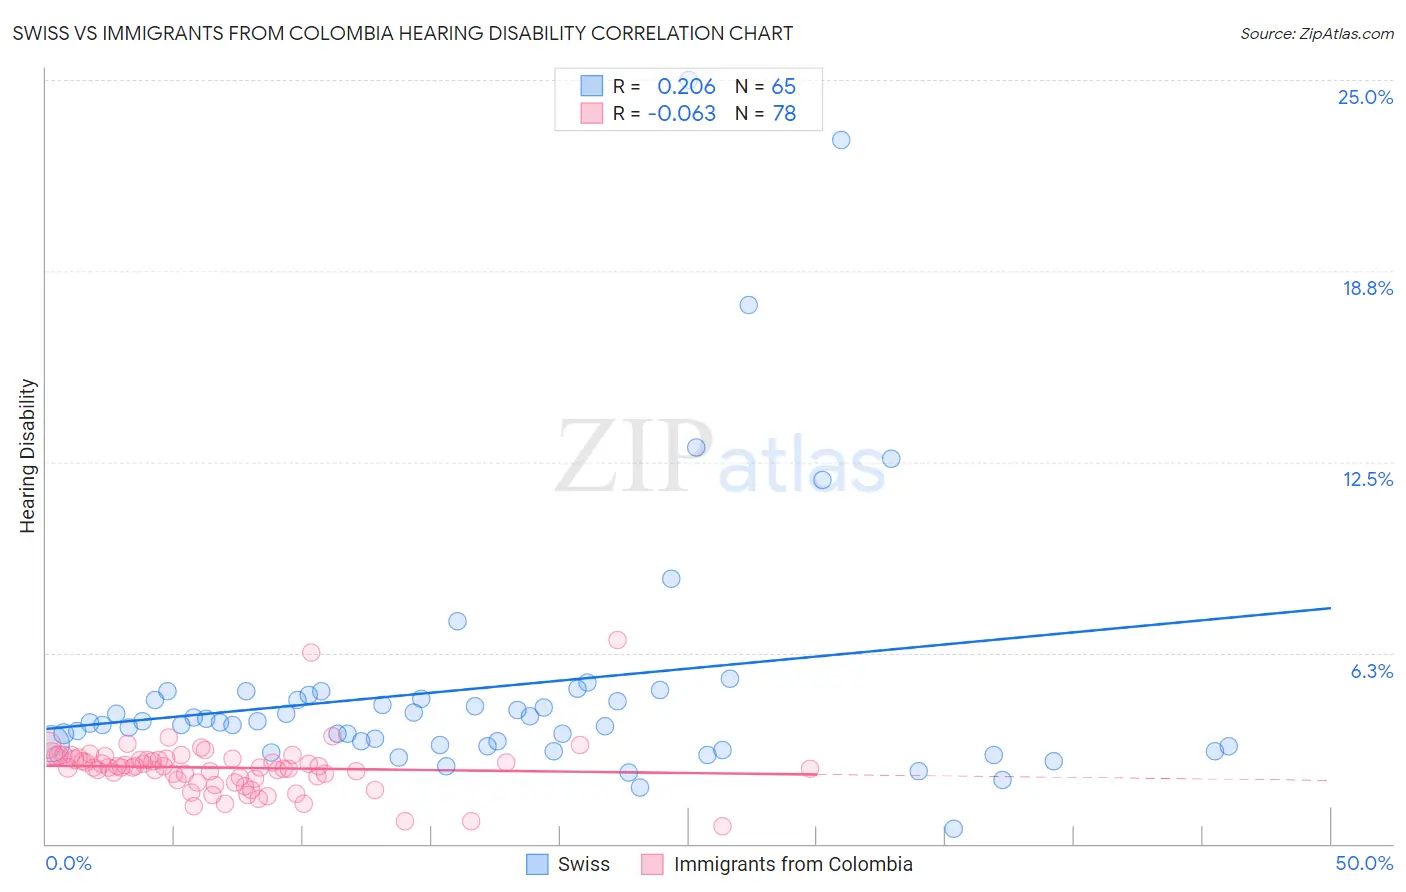
Swiss vs Immigrants from Colombia Hearing Disability Correlation Chart
The statistical analysis conducted on geographies consisting of 464,835,494 people shows a weak positive correlation between the proportion of Swiss and percentage of population with hearing disability in the United States with a correlation coefficient (R) of 0.206 and weighted average of 3.5%. Similarly, the statistical analysis conducted on geographies consisting of 378,548,694 people shows a slight negative correlation between the proportion of Immigrants from Colombia and percentage of population with hearing disability in the United States with a correlation coefficient (R) of -0.063 and weighted average of 2.7%, a difference of 31.0%.
Hearing Disability Correlation Summary
| Measurement | Swiss | Immigrants from Colombia |
| Minimum | 0.50% | 0.57% |
| Maximum | 25.0% | 6.7% |
| Range | 24.5% | 6.1% |
| Mean | 5.1% | 2.5% |
| Median | 4.0% | 2.5% |
| Interquartile 25% (IQ1) | 3.2% | 2.1% |
| Interquartile 75% (IQ3) | 4.8% | 2.8% |
| Interquartile Range (IQR) | 1.6% | 0.62% |
| Standard Deviation (Sample) | 4.3% | 0.89% |
| Standard Deviation (Population) | 4.3% | 0.88% |
Similar Demographics by Hearing Disability
Demographics Similar to Swiss by Hearing Disability
In terms of hearing disability, the demographic groups most similar to Swiss are Czechoslovakian (3.6%, a difference of 0.20%), Puerto Rican (3.5%, a difference of 0.32%), Danish (3.6%, a difference of 0.32%), Fijian (3.5%, a difference of 0.39%), and Czech (3.5%, a difference of 0.66%).
| Demographics | Rating | Rank | Hearing Disability |
| Canadians | 0.1 /100 | #267 | Tragic 3.5% |
| Spaniards | 0.1 /100 | #268 | Tragic 3.5% |
| Ute | 0.1 /100 | #269 | Tragic 3.5% |
| Europeans | 0.1 /100 | #270 | Tragic 3.5% |
| Czechs | 0.1 /100 | #271 | Tragic 3.5% |
| Fijians | 0.0 /100 | #272 | Tragic 3.5% |
| Puerto Ricans | 0.0 /100 | #273 | Tragic 3.5% |
| Swiss | 0.0 /100 | #274 | Tragic 3.5% |
| Czechoslovakians | 0.0 /100 | #275 | Tragic 3.6% |
| Danes | 0.0 /100 | #276 | Tragic 3.6% |
| Immigrants | Nonimmigrants | 0.0 /100 | #277 | Tragic 3.6% |
| Basques | 0.0 /100 | #278 | Tragic 3.6% |
| Slovaks | 0.0 /100 | #279 | Tragic 3.6% |
| French American Indians | 0.0 /100 | #280 | Tragic 3.6% |
| Scandinavians | 0.0 /100 | #281 | Tragic 3.6% |
Demographics Similar to Immigrants from Colombia by Hearing Disability
In terms of hearing disability, the demographic groups most similar to Immigrants from Colombia are Immigrants from Uzbekistan (2.7%, a difference of 0.0%), Indian (Asian) (2.7%, a difference of 0.050%), Immigrants from Sri Lanka (2.7%, a difference of 0.11%), Immigrants from Egypt (2.7%, a difference of 0.14%), and Immigrants from Nepal (2.7%, a difference of 0.19%).
| Demographics | Rating | Rank | Hearing Disability |
| Immigrants | Ethiopia | 99.0 /100 | #55 | Exceptional 2.7% |
| Immigrants | Nicaragua | 99.0 /100 | #56 | Exceptional 2.7% |
| South Americans | 99.0 /100 | #57 | Exceptional 2.7% |
| Immigrants | Peru | 98.6 /100 | #58 | Exceptional 2.7% |
| Immigrants | Eritrea | 98.5 /100 | #59 | Exceptional 2.7% |
| Immigrants | Egypt | 98.5 /100 | #60 | Exceptional 2.7% |
| Immigrants | Uzbekistan | 98.4 /100 | #61 | Exceptional 2.7% |
| Immigrants | Colombia | 98.4 /100 | #62 | Exceptional 2.7% |
| Indians (Asian) | 98.4 /100 | #63 | Exceptional 2.7% |
| Immigrants | Sri Lanka | 98.4 /100 | #64 | Exceptional 2.7% |
| Immigrants | Nepal | 98.3 /100 | #65 | Exceptional 2.7% |
| Immigrants | Belize | 98.2 /100 | #66 | Exceptional 2.7% |
| Egyptians | 98.1 /100 | #67 | Exceptional 2.7% |
| Immigrants | Africa | 98.0 /100 | #68 | Exceptional 2.7% |
| Nicaraguans | 97.9 /100 | #69 | Exceptional 2.7% |