Swiss vs Kiowa Hearing Disability
COMPARE
Swiss
Kiowa
Hearing Disability
Hearing Disability Comparison
Swiss
Kiowa
3.5%
HEARING DISABILITY
0.0/ 100
METRIC RATING
274th/ 347
METRIC RANK
4.3%
HEARING DISABILITY
0.0/ 100
METRIC RATING
335th/ 347
METRIC RANK
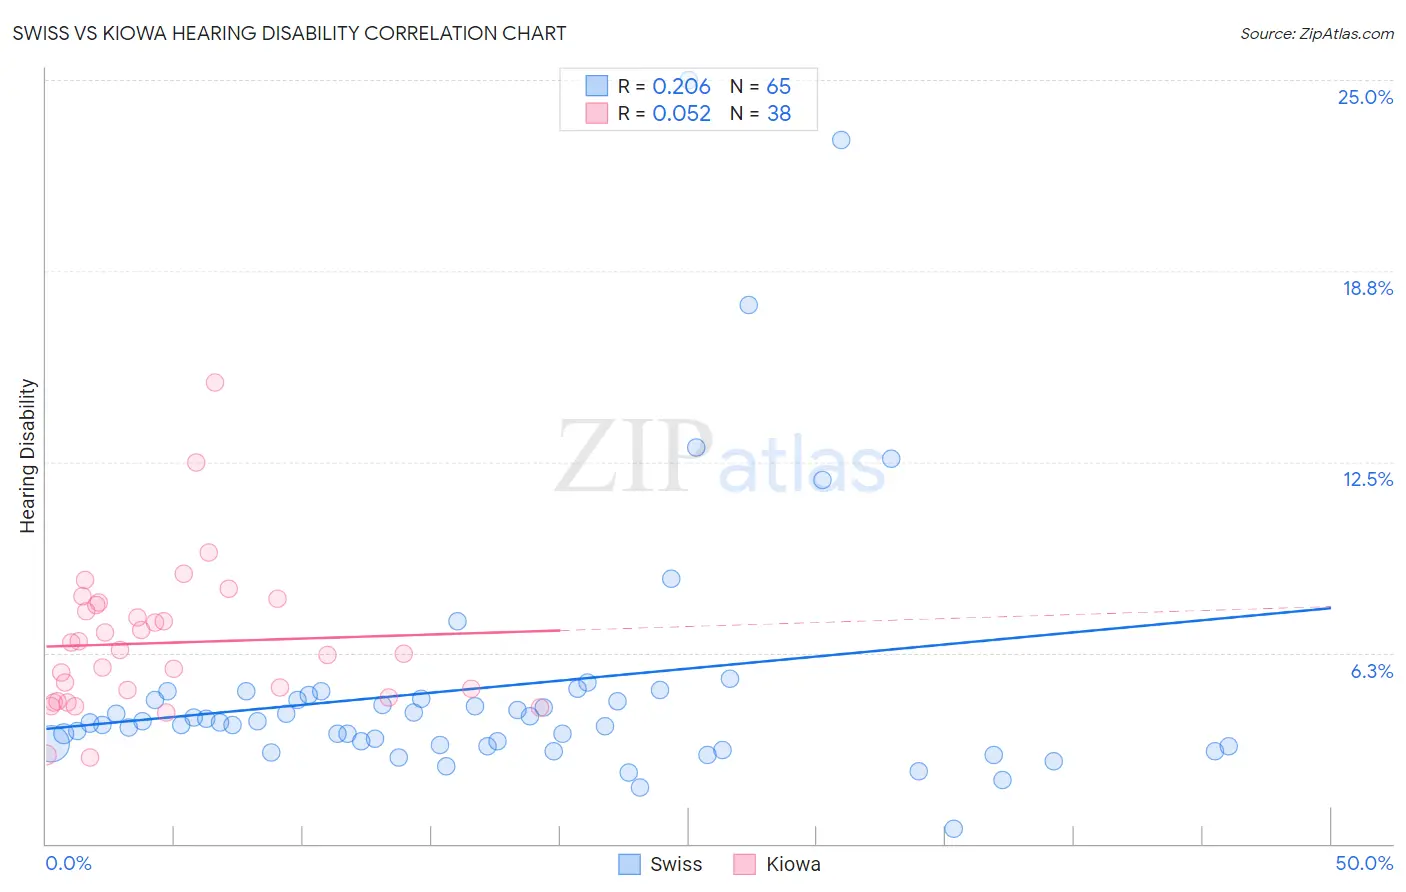
Swiss vs Kiowa Hearing Disability Correlation Chart
The statistical analysis conducted on geographies consisting of 464,835,494 people shows a weak positive correlation between the proportion of Swiss and percentage of population with hearing disability in the United States with a correlation coefficient (R) of 0.206 and weighted average of 3.5%. Similarly, the statistical analysis conducted on geographies consisting of 56,096,605 people shows a slight positive correlation between the proportion of Kiowa and percentage of population with hearing disability in the United States with a correlation coefficient (R) of 0.052 and weighted average of 4.3%, a difference of 22.4%.
Hearing Disability Correlation Summary
| Measurement | Swiss | Kiowa |
| Minimum | 0.50% | 2.8% |
| Maximum | 25.0% | 15.1% |
| Range | 24.5% | 12.2% |
| Mean | 5.1% | 6.6% |
| Median | 4.0% | 6.3% |
| Interquartile 25% (IQ1) | 3.2% | 4.8% |
| Interquartile 75% (IQ3) | 4.8% | 7.8% |
| Interquartile Range (IQR) | 1.6% | 3.1% |
| Standard Deviation (Sample) | 4.3% | 2.4% |
| Standard Deviation (Population) | 4.3% | 2.4% |
Similar Demographics by Hearing Disability
Demographics Similar to Swiss by Hearing Disability
In terms of hearing disability, the demographic groups most similar to Swiss are Czechoslovakian (3.6%, a difference of 0.20%), Puerto Rican (3.5%, a difference of 0.32%), Danish (3.6%, a difference of 0.32%), Fijian (3.5%, a difference of 0.39%), and Czech (3.5%, a difference of 0.66%).
| Demographics | Rating | Rank | Hearing Disability |
| Canadians | 0.1 /100 | #267 | Tragic 3.5% |
| Spaniards | 0.1 /100 | #268 | Tragic 3.5% |
| Ute | 0.1 /100 | #269 | Tragic 3.5% |
| Europeans | 0.1 /100 | #270 | Tragic 3.5% |
| Czechs | 0.1 /100 | #271 | Tragic 3.5% |
| Fijians | 0.0 /100 | #272 | Tragic 3.5% |
| Puerto Ricans | 0.0 /100 | #273 | Tragic 3.5% |
| Swiss | 0.0 /100 | #274 | Tragic 3.5% |
| Czechoslovakians | 0.0 /100 | #275 | Tragic 3.6% |
| Danes | 0.0 /100 | #276 | Tragic 3.6% |
| Immigrants | Nonimmigrants | 0.0 /100 | #277 | Tragic 3.6% |
| Basques | 0.0 /100 | #278 | Tragic 3.6% |
| Slovaks | 0.0 /100 | #279 | Tragic 3.6% |
| French American Indians | 0.0 /100 | #280 | Tragic 3.6% |
| Scandinavians | 0.0 /100 | #281 | Tragic 3.6% |
Demographics Similar to Kiowa by Hearing Disability
In terms of hearing disability, the demographic groups most similar to Kiowa are Creek (4.4%, a difference of 0.71%), Aleut (4.3%, a difference of 1.3%), Dutch West Indian (4.3%, a difference of 1.9%), Houma (4.2%, a difference of 2.5%), and Cherokee (4.2%, a difference of 3.2%).
| Demographics | Rating | Rank | Hearing Disability |
| Tohono O'odham | 0.0 /100 | #328 | Tragic 4.2% |
| Crow | 0.0 /100 | #329 | Tragic 4.2% |
| Natives/Alaskans | 0.0 /100 | #330 | Tragic 4.2% |
| Cherokee | 0.0 /100 | #331 | Tragic 4.2% |
| Houma | 0.0 /100 | #332 | Tragic 4.2% |
| Dutch West Indians | 0.0 /100 | #333 | Tragic 4.3% |
| Aleuts | 0.0 /100 | #334 | Tragic 4.3% |
| Kiowa | 0.0 /100 | #335 | Tragic 4.3% |
| Creek | 0.0 /100 | #336 | Tragic 4.4% |
| Chickasaw | 0.0 /100 | #337 | Tragic 4.5% |
| Alaska Natives | 0.0 /100 | #338 | Tragic 4.5% |
| Choctaw | 0.0 /100 | #339 | Tragic 4.5% |
| Pueblo | 0.0 /100 | #340 | Tragic 4.6% |
| Navajo | 0.0 /100 | #341 | Tragic 4.6% |
| Tsimshian | 0.0 /100 | #342 | Tragic 4.7% |