Swiss vs Immigrants from Cameroon Hearing Disability
COMPARE
Swiss
Immigrants from Cameroon
Hearing Disability
Hearing Disability Comparison
Swiss
Immigrants from Cameroon
3.5%
HEARING DISABILITY
0.0/ 100
METRIC RATING
274th/ 347
METRIC RANK
2.6%
HEARING DISABILITY
99.7/ 100
METRIC RATING
31st/ 347
METRIC RANK
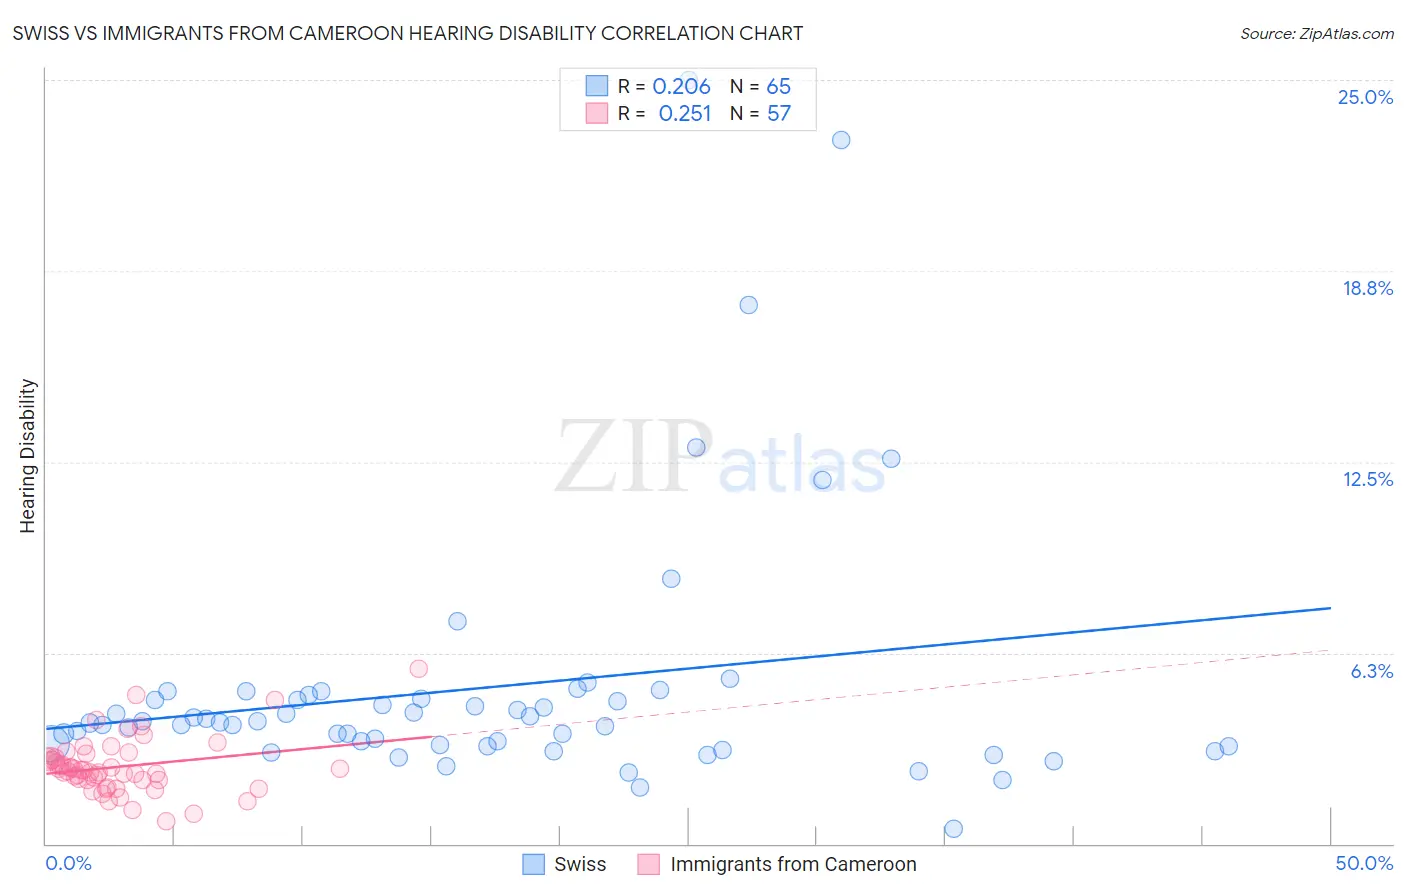
Swiss vs Immigrants from Cameroon Hearing Disability Correlation Chart
The statistical analysis conducted on geographies consisting of 464,835,494 people shows a weak positive correlation between the proportion of Swiss and percentage of population with hearing disability in the United States with a correlation coefficient (R) of 0.206 and weighted average of 3.5%. Similarly, the statistical analysis conducted on geographies consisting of 130,730,708 people shows a weak positive correlation between the proportion of Immigrants from Cameroon and percentage of population with hearing disability in the United States with a correlation coefficient (R) of 0.251 and weighted average of 2.6%, a difference of 36.6%.
Hearing Disability Correlation Summary
| Measurement | Swiss | Immigrants from Cameroon |
| Minimum | 0.50% | 0.75% |
| Maximum | 25.0% | 5.7% |
| Range | 24.5% | 5.0% |
| Mean | 5.1% | 2.5% |
| Median | 4.0% | 2.4% |
| Interquartile 25% (IQ1) | 3.2% | 2.1% |
| Interquartile 75% (IQ3) | 4.8% | 2.8% |
| Interquartile Range (IQR) | 1.6% | 0.75% |
| Standard Deviation (Sample) | 4.3% | 0.91% |
| Standard Deviation (Population) | 4.3% | 0.90% |
Similar Demographics by Hearing Disability
Demographics Similar to Swiss by Hearing Disability
In terms of hearing disability, the demographic groups most similar to Swiss are Czechoslovakian (3.6%, a difference of 0.20%), Puerto Rican (3.5%, a difference of 0.32%), Danish (3.6%, a difference of 0.32%), Fijian (3.5%, a difference of 0.39%), and Czech (3.5%, a difference of 0.66%).
| Demographics | Rating | Rank | Hearing Disability |
| Canadians | 0.1 /100 | #267 | Tragic 3.5% |
| Spaniards | 0.1 /100 | #268 | Tragic 3.5% |
| Ute | 0.1 /100 | #269 | Tragic 3.5% |
| Europeans | 0.1 /100 | #270 | Tragic 3.5% |
| Czechs | 0.1 /100 | #271 | Tragic 3.5% |
| Fijians | 0.0 /100 | #272 | Tragic 3.5% |
| Puerto Ricans | 0.0 /100 | #273 | Tragic 3.5% |
| Swiss | 0.0 /100 | #274 | Tragic 3.5% |
| Czechoslovakians | 0.0 /100 | #275 | Tragic 3.6% |
| Danes | 0.0 /100 | #276 | Tragic 3.6% |
| Immigrants | Nonimmigrants | 0.0 /100 | #277 | Tragic 3.6% |
| Basques | 0.0 /100 | #278 | Tragic 3.6% |
| Slovaks | 0.0 /100 | #279 | Tragic 3.6% |
| French American Indians | 0.0 /100 | #280 | Tragic 3.6% |
| Scandinavians | 0.0 /100 | #281 | Tragic 3.6% |
Demographics Similar to Immigrants from Cameroon by Hearing Disability
In terms of hearing disability, the demographic groups most similar to Immigrants from Cameroon are Immigrants from Caribbean (2.6%, a difference of 0.010%), Bolivian (2.6%, a difference of 0.090%), Immigrants from Haiti (2.6%, a difference of 0.11%), Immigrants from Venezuela (2.6%, a difference of 0.14%), and Filipino (2.6%, a difference of 0.40%).
| Demographics | Rating | Rank | Hearing Disability |
| Immigrants | Ghana | 99.8 /100 | #24 | Exceptional 2.6% |
| Immigrants | El Salvador | 99.7 /100 | #25 | Exceptional 2.6% |
| Immigrants | Senegal | 99.7 /100 | #26 | Exceptional 2.6% |
| Immigrants | South Central Asia | 99.7 /100 | #27 | Exceptional 2.6% |
| Immigrants | Haiti | 99.7 /100 | #28 | Exceptional 2.6% |
| Bolivians | 99.7 /100 | #29 | Exceptional 2.6% |
| Immigrants | Caribbean | 99.7 /100 | #30 | Exceptional 2.6% |
| Immigrants | Cameroon | 99.7 /100 | #31 | Exceptional 2.6% |
| Immigrants | Venezuela | 99.7 /100 | #32 | Exceptional 2.6% |
| Filipinos | 99.6 /100 | #33 | Exceptional 2.6% |
| Immigrants | Pakistan | 99.6 /100 | #34 | Exceptional 2.6% |
| Salvadorans | 99.6 /100 | #35 | Exceptional 2.6% |
| Okinawans | 99.6 /100 | #36 | Exceptional 2.6% |
| Immigrants | Western Africa | 99.6 /100 | #37 | Exceptional 2.6% |
| Immigrants | Jamaica | 99.5 /100 | #38 | Exceptional 2.6% |