Tongan vs Immigrants from Sri Lanka Vision Disability
COMPARE
Tongan
Immigrants from Sri Lanka
Vision Disability
Vision Disability Comparison
Tongans
Immigrants from Sri Lanka
2.0%
VISION DISABILITY
99.5/ 100
METRIC RATING
51st/ 347
METRIC RANK
1.9%
VISION DISABILITY
100.0/ 100
METRIC RATING
19th/ 347
METRIC RANK
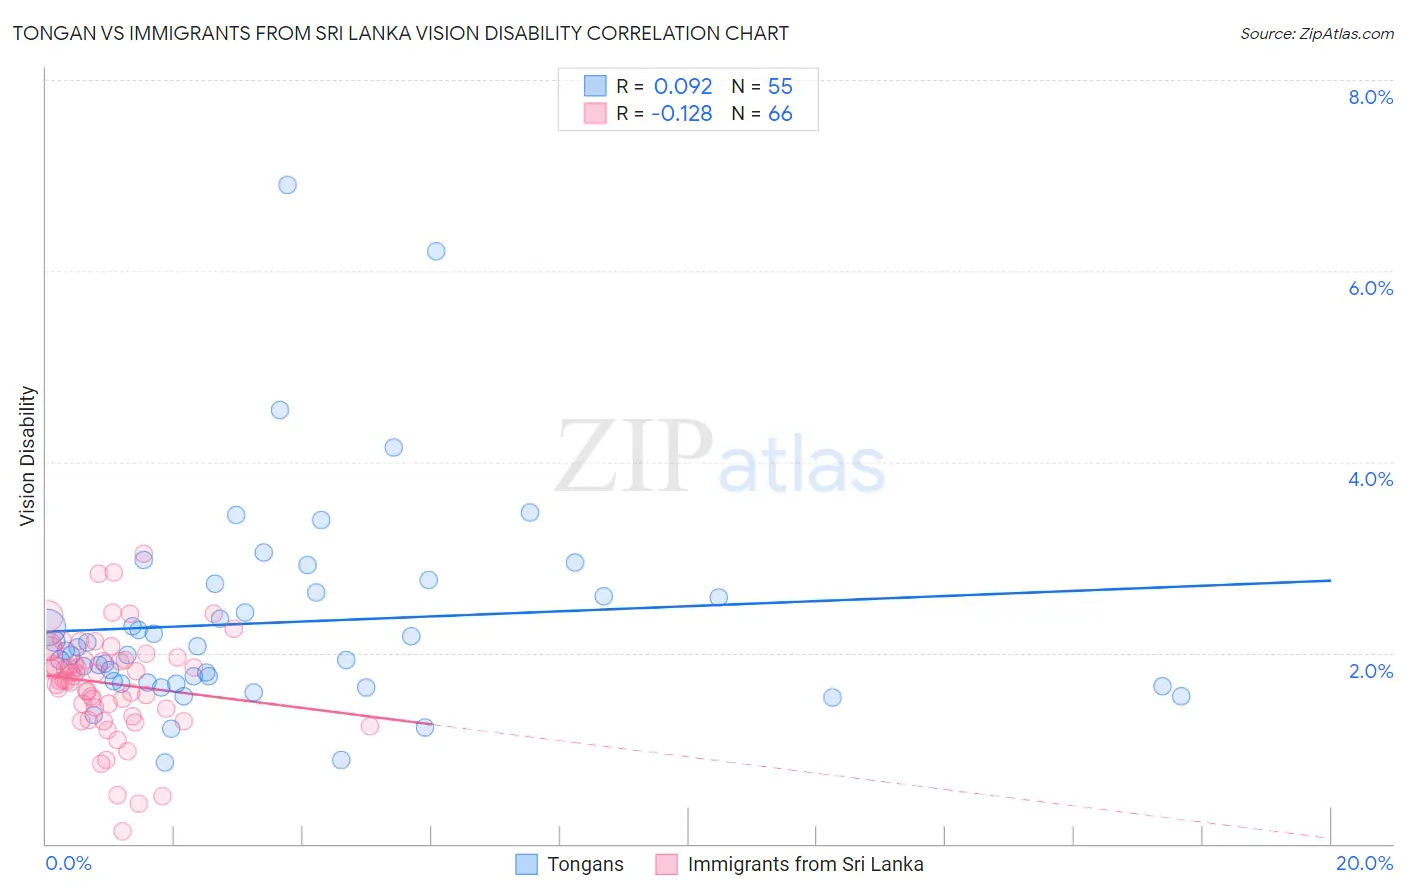
Tongan vs Immigrants from Sri Lanka Vision Disability Correlation Chart
The statistical analysis conducted on geographies consisting of 102,891,232 people shows a slight positive correlation between the proportion of Tongans and percentage of population with vision disability in the United States with a correlation coefficient (R) of 0.092 and weighted average of 2.0%. Similarly, the statistical analysis conducted on geographies consisting of 149,673,747 people shows a poor negative correlation between the proportion of Immigrants from Sri Lanka and percentage of population with vision disability in the United States with a correlation coefficient (R) of -0.128 and weighted average of 1.9%, a difference of 5.7%.
Vision Disability Correlation Summary
| Measurement | Tongan | Immigrants from Sri Lanka |
| Minimum | 0.85% | 0.13% |
| Maximum | 6.9% | 3.0% |
| Range | 6.1% | 2.9% |
| Mean | 2.3% | 1.7% |
| Median | 2.0% | 1.7% |
| Interquartile 25% (IQ1) | 1.7% | 1.4% |
| Interquartile 75% (IQ3) | 2.6% | 1.9% |
| Interquartile Range (IQR) | 0.96% | 0.50% |
| Standard Deviation (Sample) | 1.1% | 0.55% |
| Standard Deviation (Population) | 1.1% | 0.54% |
Similar Demographics by Vision Disability
Demographics Similar to Tongans by Vision Disability
In terms of vision disability, the demographic groups most similar to Tongans are Afghan (2.0%, a difference of 0.090%), Latvian (2.0%, a difference of 0.15%), Israeli (2.0%, a difference of 0.22%), Immigrants from Serbia (2.0%, a difference of 0.31%), and Immigrants from Belarus (2.0%, a difference of 0.42%).
| Demographics | Rating | Rank | Vision Disability |
| Immigrants | Indonesia | 99.7 /100 | #44 | Exceptional 2.0% |
| Ethiopians | 99.7 /100 | #45 | Exceptional 2.0% |
| Immigrants | Sweden | 99.7 /100 | #46 | Exceptional 2.0% |
| Immigrants | Bulgaria | 99.7 /100 | #47 | Exceptional 2.0% |
| Israelis | 99.6 /100 | #48 | Exceptional 2.0% |
| Latvians | 99.5 /100 | #49 | Exceptional 2.0% |
| Afghans | 99.5 /100 | #50 | Exceptional 2.0% |
| Tongans | 99.5 /100 | #51 | Exceptional 2.0% |
| Immigrants | Serbia | 99.4 /100 | #52 | Exceptional 2.0% |
| Immigrants | Belarus | 99.3 /100 | #53 | Exceptional 2.0% |
| Macedonians | 99.3 /100 | #54 | Exceptional 2.0% |
| Laotians | 99.3 /100 | #55 | Exceptional 2.0% |
| Jordanians | 99.2 /100 | #56 | Exceptional 2.0% |
| Somalis | 99.2 /100 | #57 | Exceptional 2.0% |
| Immigrants | Saudi Arabia | 99.2 /100 | #58 | Exceptional 2.0% |
Demographics Similar to Immigrants from Sri Lanka by Vision Disability
In terms of vision disability, the demographic groups most similar to Immigrants from Sri Lanka are Asian (1.9%, a difference of 1.1%), Bolivian (1.9%, a difference of 1.2%), Turkish (1.9%, a difference of 1.4%), Immigrants from Pakistan (1.9%, a difference of 1.4%), and Indian (Asian) (1.8%, a difference of 1.7%).
| Demographics | Rating | Rank | Vision Disability |
| Immigrants | Korea | 100.0 /100 | #12 | Exceptional 1.8% |
| Immigrants | Eastern Asia | 100.0 /100 | #13 | Exceptional 1.8% |
| Immigrants | China | 100.0 /100 | #14 | Exceptional 1.8% |
| Immigrants | Bolivia | 100.0 /100 | #15 | Exceptional 1.8% |
| Indians (Asian) | 100.0 /100 | #16 | Exceptional 1.8% |
| Burmese | 100.0 /100 | #17 | Exceptional 1.8% |
| Bolivians | 100.0 /100 | #18 | Exceptional 1.9% |
| Immigrants | Sri Lanka | 100.0 /100 | #19 | Exceptional 1.9% |
| Asians | 100.0 /100 | #20 | Exceptional 1.9% |
| Turks | 100.0 /100 | #21 | Exceptional 1.9% |
| Immigrants | Pakistan | 100.0 /100 | #22 | Exceptional 1.9% |
| Immigrants | Asia | 99.9 /100 | #23 | Exceptional 1.9% |
| Immigrants | Lithuania | 99.9 /100 | #24 | Exceptional 1.9% |
| Bulgarians | 99.9 /100 | #25 | Exceptional 1.9% |
| Immigrants | Japan | 99.9 /100 | #26 | Exceptional 1.9% |