Swiss vs Immigrants from Sri Lanka Family Poverty
COMPARE
Swiss
Immigrants from Sri Lanka
Family Poverty
Family Poverty Comparison
Swiss
Immigrants from Sri Lanka
7.7%
FAMILY POVERTY
98.8/ 100
METRIC RATING
53rd/ 347
METRIC RANK
7.7%
FAMILY POVERTY
98.9/ 100
METRIC RATING
48th/ 347
METRIC RANK
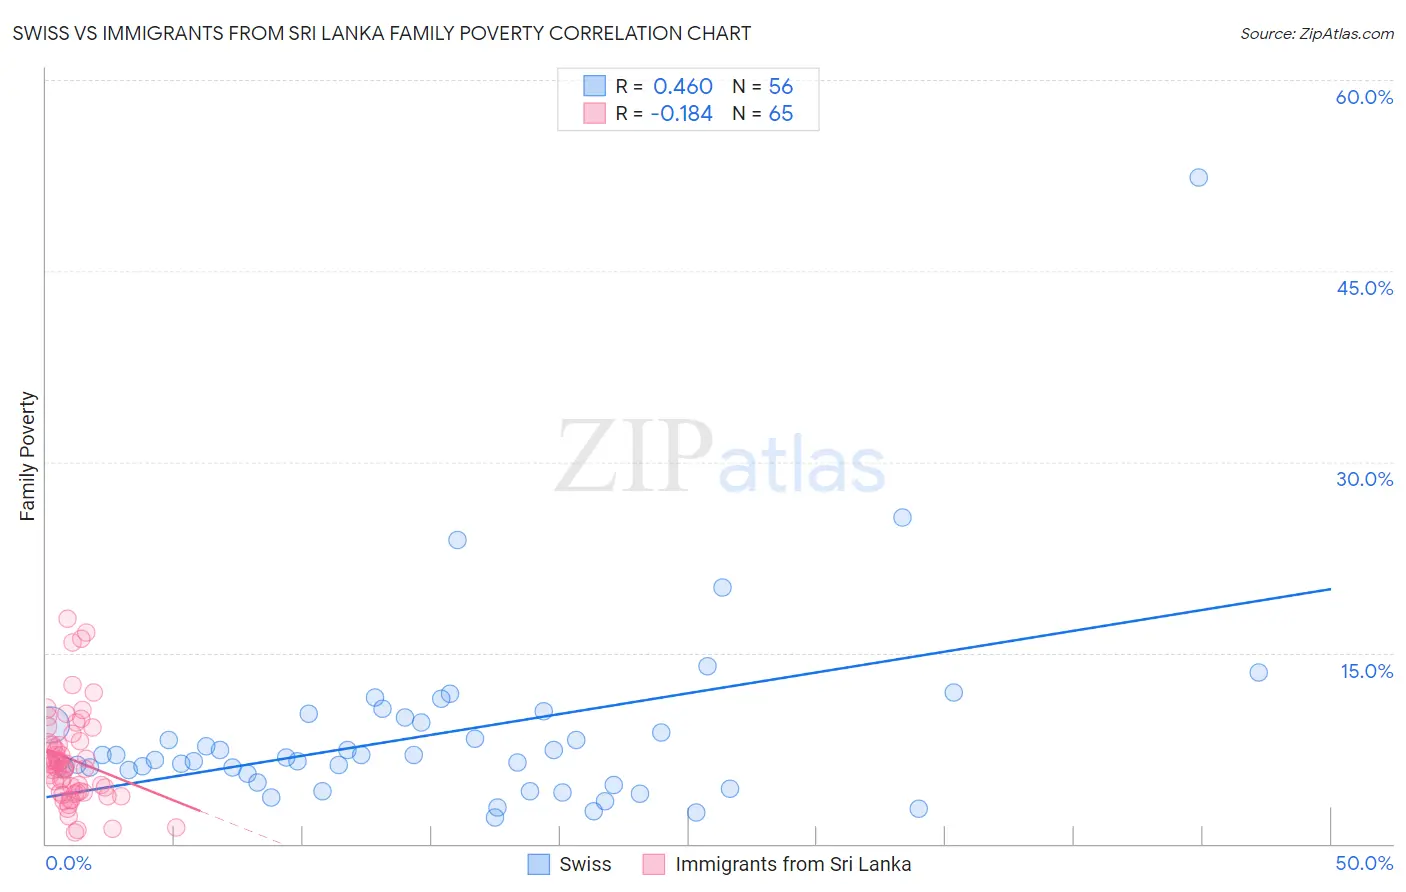
Swiss vs Immigrants from Sri Lanka Family Poverty Correlation Chart
The statistical analysis conducted on geographies consisting of 462,917,875 people shows a moderate positive correlation between the proportion of Swiss and poverty level among families in the United States with a correlation coefficient (R) of 0.460 and weighted average of 7.7%. Similarly, the statistical analysis conducted on geographies consisting of 149,580,330 people shows a poor negative correlation between the proportion of Immigrants from Sri Lanka and poverty level among families in the United States with a correlation coefficient (R) of -0.184 and weighted average of 7.7%, a difference of 0.59%.
Family Poverty Correlation Summary
| Measurement | Swiss | Immigrants from Sri Lanka |
| Minimum | 2.1% | 0.89% |
| Maximum | 52.4% | 17.7% |
| Range | 50.3% | 16.8% |
| Mean | 8.6% | 6.6% |
| Median | 6.9% | 6.1% |
| Interquartile 25% (IQ1) | 5.1% | 4.1% |
| Interquartile 75% (IQ3) | 9.7% | 8.0% |
| Interquartile Range (IQR) | 4.6% | 3.9% |
| Standard Deviation (Sample) | 7.6% | 3.6% |
| Standard Deviation (Population) | 7.5% | 3.6% |
Demographics Similar to Swiss and Immigrants from Sri Lanka by Family Poverty
In terms of family poverty, the demographic groups most similar to Swiss are Immigrants from Sweden (7.7%, a difference of 0.010%), Immigrants from Eastern Asia (7.7%, a difference of 0.040%), Indian (Asian) (7.7%, a difference of 0.060%), Immigrants from Serbia (7.7%, a difference of 0.080%), and Asian (7.7%, a difference of 0.17%). Similarly, the demographic groups most similar to Immigrants from Sri Lanka are Immigrants from Czechoslovakia (7.7%, a difference of 0.020%), Tongan (7.7%, a difference of 0.030%), Okinawan (7.7%, a difference of 0.040%), German (7.7%, a difference of 0.17%), and Immigrants from Bolivia (7.7%, a difference of 0.19%).
| Demographics | Rating | Rank | Family Poverty |
| Slovenes | 99.3 /100 | #40 | Exceptional 7.5% |
| Immigrants | Australia | 99.2 /100 | #41 | Exceptional 7.6% |
| Scandinavians | 99.1 /100 | #42 | Exceptional 7.6% |
| Immigrants | Austria | 99.1 /100 | #43 | Exceptional 7.6% |
| Germans | 99.0 /100 | #44 | Exceptional 7.7% |
| Okinawans | 98.9 /100 | #45 | Exceptional 7.7% |
| Tongans | 98.9 /100 | #46 | Exceptional 7.7% |
| Immigrants | Czechoslovakia | 98.9 /100 | #47 | Exceptional 7.7% |
| Immigrants | Sri Lanka | 98.9 /100 | #48 | Exceptional 7.7% |
| Immigrants | Bolivia | 98.9 /100 | #49 | Exceptional 7.7% |
| Immigrants | North Macedonia | 98.9 /100 | #50 | Exceptional 7.7% |
| Immigrants | Moldova | 98.8 /100 | #51 | Exceptional 7.7% |
| Indians (Asian) | 98.8 /100 | #52 | Exceptional 7.7% |
| Swiss | 98.8 /100 | #53 | Exceptional 7.7% |
| Immigrants | Sweden | 98.8 /100 | #54 | Exceptional 7.7% |
| Immigrants | Eastern Asia | 98.7 /100 | #55 | Exceptional 7.7% |
| Immigrants | Serbia | 98.7 /100 | #56 | Exceptional 7.7% |
| Asians | 98.7 /100 | #57 | Exceptional 7.7% |
| Finns | 98.7 /100 | #58 | Exceptional 7.7% |
| Europeans | 98.7 /100 | #59 | Exceptional 7.7% |
| Immigrants | Greece | 98.7 /100 | #60 | Exceptional 7.7% |