Czechoslovakian vs Immigrants from Sri Lanka Vision Disability
COMPARE
Czechoslovakian
Immigrants from Sri Lanka
Vision Disability
Vision Disability Comparison
Czechoslovakians
Immigrants from Sri Lanka
2.2%
VISION DISABILITY
21.6/ 100
METRIC RATING
198th/ 347
METRIC RANK
1.9%
VISION DISABILITY
100.0/ 100
METRIC RATING
19th/ 347
METRIC RANK
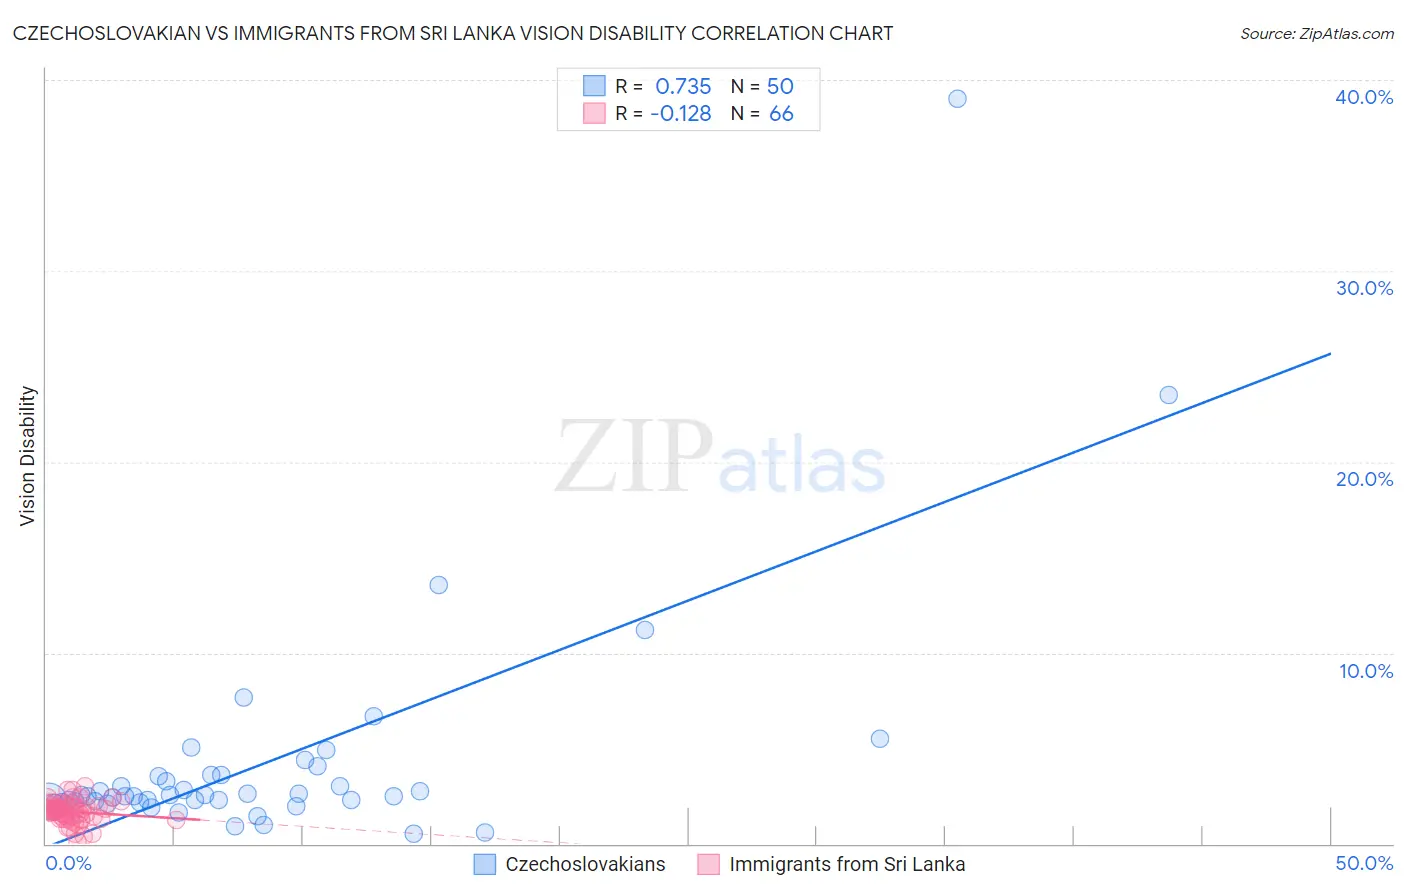
Czechoslovakian vs Immigrants from Sri Lanka Vision Disability Correlation Chart
The statistical analysis conducted on geographies consisting of 368,413,881 people shows a strong positive correlation between the proportion of Czechoslovakians and percentage of population with vision disability in the United States with a correlation coefficient (R) of 0.735 and weighted average of 2.2%. Similarly, the statistical analysis conducted on geographies consisting of 149,673,747 people shows a poor negative correlation between the proportion of Immigrants from Sri Lanka and percentage of population with vision disability in the United States with a correlation coefficient (R) of -0.128 and weighted average of 1.9%, a difference of 17.5%.
Vision Disability Correlation Summary
| Measurement | Czechoslovakian | Immigrants from Sri Lanka |
| Minimum | 0.51% | 0.13% |
| Maximum | 39.0% | 3.0% |
| Range | 38.5% | 2.9% |
| Mean | 4.3% | 1.7% |
| Median | 2.5% | 1.7% |
| Interquartile 25% (IQ1) | 2.2% | 1.4% |
| Interquartile 75% (IQ3) | 3.6% | 1.9% |
| Interquartile Range (IQR) | 1.4% | 0.50% |
| Standard Deviation (Sample) | 6.2% | 0.55% |
| Standard Deviation (Population) | 6.2% | 0.54% |
Similar Demographics by Vision Disability
Demographics Similar to Czechoslovakians by Vision Disability
In terms of vision disability, the demographic groups most similar to Czechoslovakians are Ghanaian (2.2%, a difference of 0.020%), Immigrants from El Salvador (2.2%, a difference of 0.050%), Immigrants from Grenada (2.2%, a difference of 0.13%), Immigrants from Thailand (2.2%, a difference of 0.14%), and Immigrants (2.2%, a difference of 0.19%).
| Demographics | Rating | Rank | Vision Disability |
| Canadians | 25.8 /100 | #191 | Fair 2.2% |
| Europeans | 25.7 /100 | #192 | Fair 2.2% |
| British | 25.1 /100 | #193 | Fair 2.2% |
| Immigrants | Barbados | 24.0 /100 | #194 | Fair 2.2% |
| Immigrants | Immigrants | 23.7 /100 | #195 | Fair 2.2% |
| Immigrants | Grenada | 23.1 /100 | #196 | Fair 2.2% |
| Ghanaians | 21.8 /100 | #197 | Fair 2.2% |
| Czechoslovakians | 21.6 /100 | #198 | Fair 2.2% |
| Immigrants | El Salvador | 21.0 /100 | #199 | Fair 2.2% |
| Immigrants | Thailand | 20.1 /100 | #200 | Fair 2.2% |
| Slovaks | 18.8 /100 | #201 | Poor 2.2% |
| Immigrants | Zaire | 18.0 /100 | #202 | Poor 2.2% |
| Dutch | 17.1 /100 | #203 | Poor 2.2% |
| Immigrants | Guyana | 15.9 /100 | #204 | Poor 2.2% |
| Samoans | 15.7 /100 | #205 | Poor 2.2% |
Demographics Similar to Immigrants from Sri Lanka by Vision Disability
In terms of vision disability, the demographic groups most similar to Immigrants from Sri Lanka are Asian (1.9%, a difference of 1.1%), Bolivian (1.9%, a difference of 1.2%), Turkish (1.9%, a difference of 1.4%), Immigrants from Pakistan (1.9%, a difference of 1.4%), and Indian (Asian) (1.8%, a difference of 1.7%).
| Demographics | Rating | Rank | Vision Disability |
| Immigrants | Korea | 100.0 /100 | #12 | Exceptional 1.8% |
| Immigrants | Eastern Asia | 100.0 /100 | #13 | Exceptional 1.8% |
| Immigrants | China | 100.0 /100 | #14 | Exceptional 1.8% |
| Immigrants | Bolivia | 100.0 /100 | #15 | Exceptional 1.8% |
| Indians (Asian) | 100.0 /100 | #16 | Exceptional 1.8% |
| Burmese | 100.0 /100 | #17 | Exceptional 1.8% |
| Bolivians | 100.0 /100 | #18 | Exceptional 1.9% |
| Immigrants | Sri Lanka | 100.0 /100 | #19 | Exceptional 1.9% |
| Asians | 100.0 /100 | #20 | Exceptional 1.9% |
| Turks | 100.0 /100 | #21 | Exceptional 1.9% |
| Immigrants | Pakistan | 100.0 /100 | #22 | Exceptional 1.9% |
| Immigrants | Asia | 99.9 /100 | #23 | Exceptional 1.9% |
| Immigrants | Lithuania | 99.9 /100 | #24 | Exceptional 1.9% |
| Bulgarians | 99.9 /100 | #25 | Exceptional 1.9% |
| Immigrants | Japan | 99.9 /100 | #26 | Exceptional 1.9% |