Nonimmigrants vs Immigrants from Sri Lanka Vision Disability
COMPARE
Nonimmigrants
Immigrants from Sri Lanka
Vision Disability
Vision Disability Comparison
Nonimmigrants
Immigrants from Sri Lanka
2.5%
VISION DISABILITY
0.0/ 100
METRIC RATING
289th/ 347
METRIC RANK
1.9%
VISION DISABILITY
100.0/ 100
METRIC RATING
19th/ 347
METRIC RANK
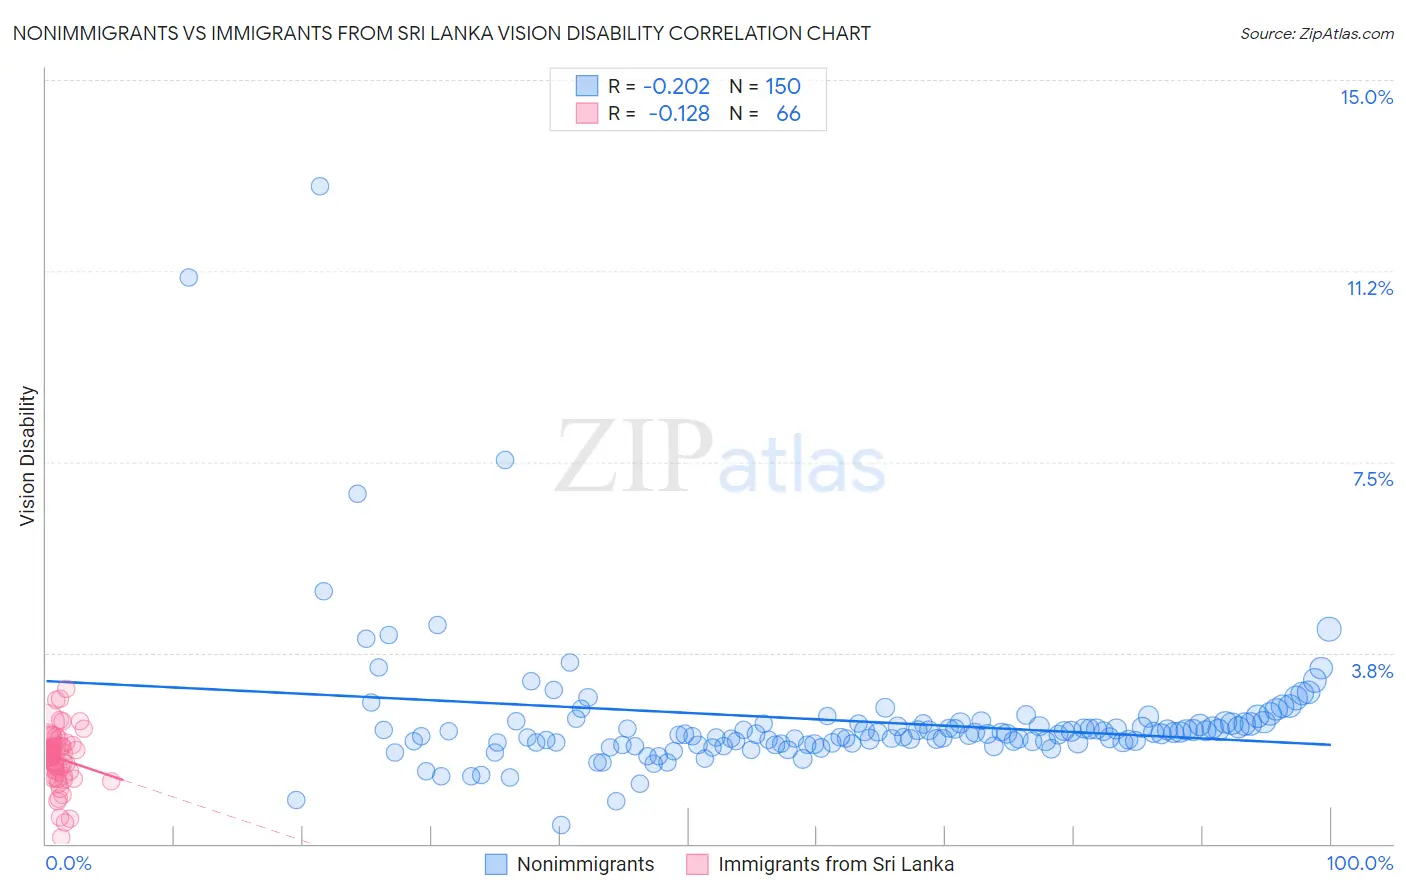
Nonimmigrants vs Immigrants from Sri Lanka Vision Disability Correlation Chart
The statistical analysis conducted on geographies consisting of 581,859,538 people shows a weak negative correlation between the proportion of Nonimmigrants and percentage of population with vision disability in the United States with a correlation coefficient (R) of -0.202 and weighted average of 2.5%. Similarly, the statistical analysis conducted on geographies consisting of 149,673,747 people shows a poor negative correlation between the proportion of Immigrants from Sri Lanka and percentage of population with vision disability in the United States with a correlation coefficient (R) of -0.128 and weighted average of 1.9%, a difference of 31.9%.
Vision Disability Correlation Summary
| Measurement | Nonimmigrants | Immigrants from Sri Lanka |
| Minimum | 0.37% | 0.13% |
| Maximum | 12.9% | 3.0% |
| Range | 12.5% | 2.9% |
| Mean | 2.4% | 1.7% |
| Median | 2.2% | 1.7% |
| Interquartile 25% (IQ1) | 2.0% | 1.4% |
| Interquartile 75% (IQ3) | 2.4% | 1.9% |
| Interquartile Range (IQR) | 0.38% | 0.50% |
| Standard Deviation (Sample) | 1.4% | 0.55% |
| Standard Deviation (Population) | 1.4% | 0.54% |
Similar Demographics by Vision Disability
Demographics Similar to Nonimmigrants by Vision Disability
In terms of vision disability, the demographic groups most similar to Nonimmigrants are Immigrants from Cuba (2.5%, a difference of 0.14%), French American Indian (2.5%, a difference of 0.41%), Honduran (2.5%, a difference of 0.43%), Immigrants from Honduras (2.5%, a difference of 0.53%), and Sioux (2.5%, a difference of 0.57%).
| Demographics | Rating | Rank | Vision Disability |
| Immigrants | Caribbean | 0.0 /100 | #282 | Tragic 2.5% |
| Puget Sound Salish | 0.0 /100 | #283 | Tragic 2.5% |
| Yakama | 0.0 /100 | #284 | Tragic 2.5% |
| Immigrants | Central America | 0.0 /100 | #285 | Tragic 2.5% |
| Sioux | 0.0 /100 | #286 | Tragic 2.5% |
| Hondurans | 0.0 /100 | #287 | Tragic 2.5% |
| French American Indians | 0.0 /100 | #288 | Tragic 2.5% |
| Immigrants | Nonimmigrants | 0.0 /100 | #289 | Tragic 2.5% |
| Immigrants | Cuba | 0.0 /100 | #290 | Tragic 2.5% |
| Immigrants | Honduras | 0.0 /100 | #291 | Tragic 2.5% |
| Crow | 0.0 /100 | #292 | Tragic 2.5% |
| Yaqui | 0.0 /100 | #293 | Tragic 2.5% |
| Ottawa | 0.0 /100 | #294 | Tragic 2.5% |
| Delaware | 0.0 /100 | #295 | Tragic 2.5% |
| Immigrants | Mexico | 0.0 /100 | #296 | Tragic 2.5% |
Demographics Similar to Immigrants from Sri Lanka by Vision Disability
In terms of vision disability, the demographic groups most similar to Immigrants from Sri Lanka are Asian (1.9%, a difference of 1.1%), Bolivian (1.9%, a difference of 1.2%), Turkish (1.9%, a difference of 1.4%), Immigrants from Pakistan (1.9%, a difference of 1.4%), and Indian (Asian) (1.8%, a difference of 1.7%).
| Demographics | Rating | Rank | Vision Disability |
| Immigrants | Korea | 100.0 /100 | #12 | Exceptional 1.8% |
| Immigrants | Eastern Asia | 100.0 /100 | #13 | Exceptional 1.8% |
| Immigrants | China | 100.0 /100 | #14 | Exceptional 1.8% |
| Immigrants | Bolivia | 100.0 /100 | #15 | Exceptional 1.8% |
| Indians (Asian) | 100.0 /100 | #16 | Exceptional 1.8% |
| Burmese | 100.0 /100 | #17 | Exceptional 1.8% |
| Bolivians | 100.0 /100 | #18 | Exceptional 1.9% |
| Immigrants | Sri Lanka | 100.0 /100 | #19 | Exceptional 1.9% |
| Asians | 100.0 /100 | #20 | Exceptional 1.9% |
| Turks | 100.0 /100 | #21 | Exceptional 1.9% |
| Immigrants | Pakistan | 100.0 /100 | #22 | Exceptional 1.9% |
| Immigrants | Asia | 99.9 /100 | #23 | Exceptional 1.9% |
| Immigrants | Lithuania | 99.9 /100 | #24 | Exceptional 1.9% |
| Bulgarians | 99.9 /100 | #25 | Exceptional 1.9% |
| Immigrants | Japan | 99.9 /100 | #26 | Exceptional 1.9% |