Swedish vs Yakama Disability
COMPARE
Swedish
Yakama
Disability
Disability Comparison
Swedes
Yakama
12.2%
DISABILITY
1.8/ 100
METRIC RATING
239th/ 347
METRIC RANK
13.4%
DISABILITY
0.0/ 100
METRIC RATING
304th/ 347
METRIC RANK
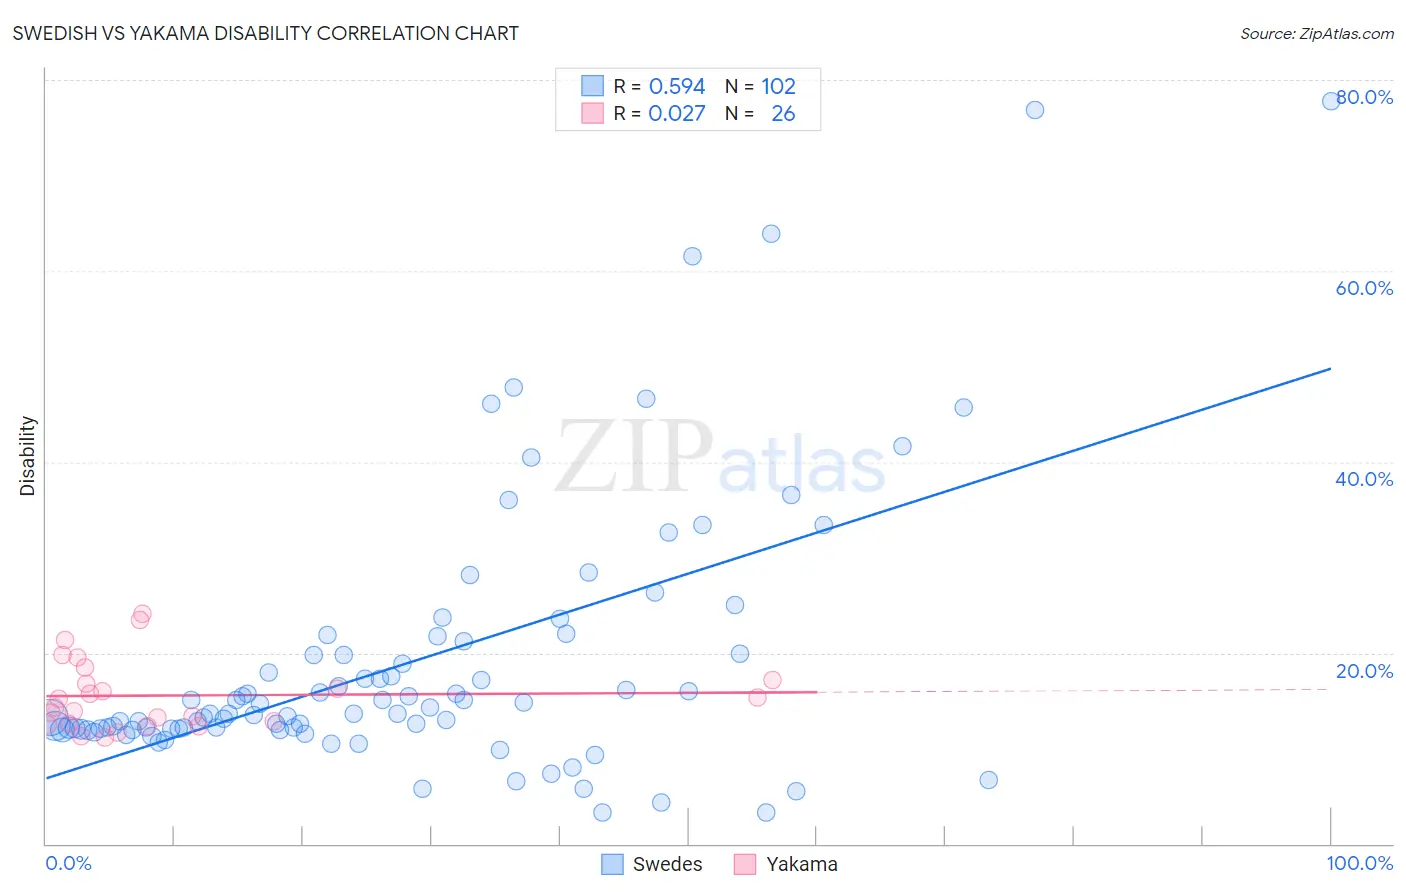
Swedish vs Yakama Disability Correlation Chart
The statistical analysis conducted on geographies consisting of 539,139,641 people shows a substantial positive correlation between the proportion of Swedes and percentage of population with a disability in the United States with a correlation coefficient (R) of 0.594 and weighted average of 12.2%. Similarly, the statistical analysis conducted on geographies consisting of 19,917,759 people shows no correlation between the proportion of Yakama and percentage of population with a disability in the United States with a correlation coefficient (R) of 0.027 and weighted average of 13.4%, a difference of 9.5%.
Disability Correlation Summary
| Measurement | Swedish | Yakama |
| Minimum | 3.3% | 11.1% |
| Maximum | 77.8% | 24.1% |
| Range | 74.5% | 13.0% |
| Mean | 19.0% | 15.5% |
| Median | 13.6% | 14.7% |
| Interquartile 25% (IQ1) | 12.0% | 12.6% |
| Interquartile 75% (IQ3) | 19.9% | 17.1% |
| Interquartile Range (IQR) | 8.0% | 4.5% |
| Standard Deviation (Sample) | 14.2% | 3.7% |
| Standard Deviation (Population) | 14.1% | 3.6% |
Similar Demographics by Disability
Demographics Similar to Swedes by Disability
In terms of disability, the demographic groups most similar to Swedes are Norwegian (12.2%, a difference of 0.040%), Hungarian (12.2%, a difference of 0.050%), Yugoslavian (12.2%, a difference of 0.050%), Immigrants from Congo (12.2%, a difference of 0.080%), and Polish (12.2%, a difference of 0.080%).
| Demographics | Rating | Rank | Disability |
| Italians | 2.5 /100 | #232 | Tragic 12.2% |
| Bahamians | 2.3 /100 | #233 | Tragic 12.2% |
| Japanese | 2.3 /100 | #234 | Tragic 12.2% |
| Yup'ik | 2.2 /100 | #235 | Tragic 12.2% |
| Chinese | 2.0 /100 | #236 | Tragic 12.2% |
| Immigrants | Congo | 1.9 /100 | #237 | Tragic 12.2% |
| Norwegians | 1.9 /100 | #238 | Tragic 12.2% |
| Swedes | 1.8 /100 | #239 | Tragic 12.2% |
| Hungarians | 1.7 /100 | #240 | Tragic 12.2% |
| Yugoslavians | 1.7 /100 | #241 | Tragic 12.2% |
| Poles | 1.7 /100 | #242 | Tragic 12.2% |
| British | 1.5 /100 | #243 | Tragic 12.2% |
| Basques | 1.5 /100 | #244 | Tragic 12.2% |
| Liberians | 1.5 /100 | #245 | Tragic 12.2% |
| Swiss | 1.5 /100 | #246 | Tragic 12.2% |
Demographics Similar to Yakama by Disability
In terms of disability, the demographic groups most similar to Yakama are French Canadian (13.4%, a difference of 0.35%), Scotch-Irish (13.3%, a difference of 0.47%), Cape Verdean (13.5%, a difference of 0.95%), Shoshone (13.5%, a difference of 1.0%), and French American Indian (13.5%, a difference of 1.1%).
| Demographics | Rating | Rank | Disability |
| Hopi | 0.0 /100 | #297 | Tragic 13.2% |
| Alaska Natives | 0.0 /100 | #298 | Tragic 13.2% |
| French | 0.0 /100 | #299 | Tragic 13.2% |
| Pennsylvania Germans | 0.0 /100 | #300 | Tragic 13.2% |
| Immigrants | Micronesia | 0.0 /100 | #301 | Tragic 13.2% |
| Arapaho | 0.0 /100 | #302 | Tragic 13.2% |
| Scotch-Irish | 0.0 /100 | #303 | Tragic 13.3% |
| Yakama | 0.0 /100 | #304 | Tragic 13.4% |
| French Canadians | 0.0 /100 | #305 | Tragic 13.4% |
| Cape Verdeans | 0.0 /100 | #306 | Tragic 13.5% |
| Shoshone | 0.0 /100 | #307 | Tragic 13.5% |
| French American Indians | 0.0 /100 | #308 | Tragic 13.5% |
| Tlingit-Haida | 0.0 /100 | #309 | Tragic 13.5% |
| Blackfeet | 0.0 /100 | #310 | Tragic 13.6% |
| Delaware | 0.0 /100 | #311 | Tragic 13.6% |