Swedish vs Immigrants Disability
COMPARE
Swedish
Immigrants
Disability
Disability Comparison
Swedes
Immigrants
12.2%
DISABILITY
1.8/ 100
METRIC RATING
239th/ 347
METRIC RANK
11.3%
DISABILITY
96.4/ 100
METRIC RATING
104th/ 347
METRIC RANK
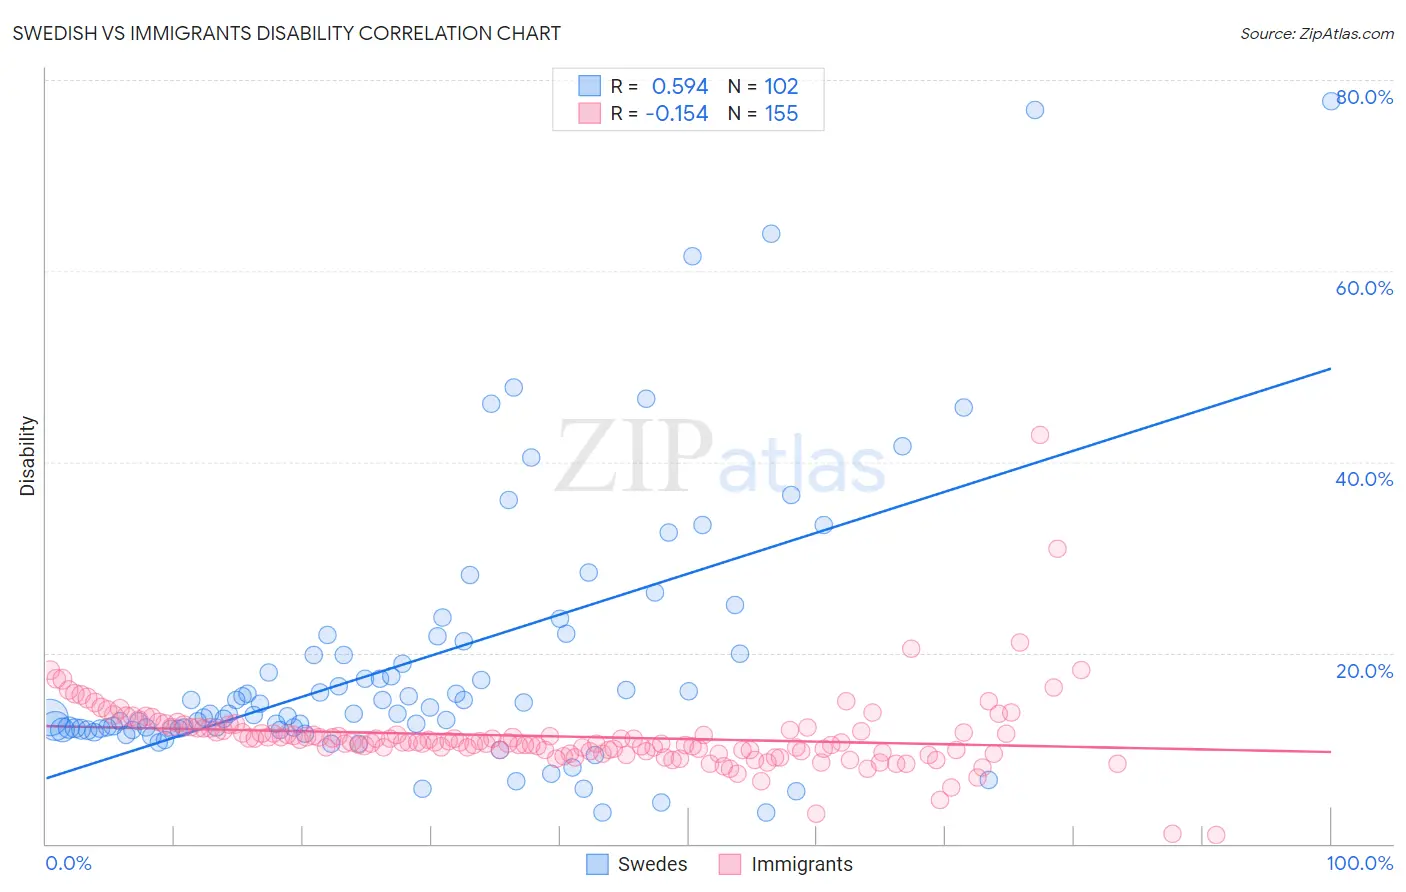
Swedish vs Immigrants Disability Correlation Chart
The statistical analysis conducted on geographies consisting of 539,139,641 people shows a substantial positive correlation between the proportion of Swedes and percentage of population with a disability in the United States with a correlation coefficient (R) of 0.594 and weighted average of 12.2%. Similarly, the statistical analysis conducted on geographies consisting of 577,602,832 people shows a poor negative correlation between the proportion of Immigrants and percentage of population with a disability in the United States with a correlation coefficient (R) of -0.154 and weighted average of 11.3%, a difference of 8.4%.
Disability Correlation Summary
| Measurement | Swedish | Immigrants |
| Minimum | 3.3% | 0.89% |
| Maximum | 77.8% | 42.9% |
| Range | 74.5% | 42.0% |
| Mean | 19.0% | 11.3% |
| Median | 13.6% | 10.6% |
| Interquartile 25% (IQ1) | 12.0% | 9.7% |
| Interquartile 75% (IQ3) | 19.9% | 12.1% |
| Interquartile Range (IQR) | 8.0% | 2.4% |
| Standard Deviation (Sample) | 14.2% | 4.1% |
| Standard Deviation (Population) | 14.1% | 4.1% |
Similar Demographics by Disability
Demographics Similar to Swedes by Disability
In terms of disability, the demographic groups most similar to Swedes are Norwegian (12.2%, a difference of 0.040%), Hungarian (12.2%, a difference of 0.050%), Yugoslavian (12.2%, a difference of 0.050%), Immigrants from Congo (12.2%, a difference of 0.080%), and Polish (12.2%, a difference of 0.080%).
| Demographics | Rating | Rank | Disability |
| Italians | 2.5 /100 | #232 | Tragic 12.2% |
| Bahamians | 2.3 /100 | #233 | Tragic 12.2% |
| Japanese | 2.3 /100 | #234 | Tragic 12.2% |
| Yup'ik | 2.2 /100 | #235 | Tragic 12.2% |
| Chinese | 2.0 /100 | #236 | Tragic 12.2% |
| Immigrants | Congo | 1.9 /100 | #237 | Tragic 12.2% |
| Norwegians | 1.9 /100 | #238 | Tragic 12.2% |
| Swedes | 1.8 /100 | #239 | Tragic 12.2% |
| Hungarians | 1.7 /100 | #240 | Tragic 12.2% |
| Yugoslavians | 1.7 /100 | #241 | Tragic 12.2% |
| Poles | 1.7 /100 | #242 | Tragic 12.2% |
| British | 1.5 /100 | #243 | Tragic 12.2% |
| Basques | 1.5 /100 | #244 | Tragic 12.2% |
| Liberians | 1.5 /100 | #245 | Tragic 12.2% |
| Swiss | 1.5 /100 | #246 | Tragic 12.2% |
Demographics Similar to Immigrants by Disability
In terms of disability, the demographic groups most similar to Immigrants are Immigrants from Uruguay (11.3%, a difference of 0.010%), Immigrants from Kazakhstan (11.3%, a difference of 0.010%), Immigrants from Eastern Europe (11.3%, a difference of 0.040%), Nicaraguan (11.3%, a difference of 0.060%), and Immigrants from Eastern Africa (11.3%, a difference of 0.080%).
| Demographics | Rating | Rank | Disability |
| Bhutanese | 97.4 /100 | #97 | Exceptional 11.2% |
| Uruguayans | 97.4 /100 | #98 | Exceptional 11.2% |
| Immigrants | Czechoslovakia | 97.4 /100 | #99 | Exceptional 11.2% |
| Immigrants | Greece | 96.9 /100 | #100 | Exceptional 11.3% |
| Immigrants | Nicaragua | 96.8 /100 | #101 | Exceptional 11.3% |
| Immigrants | Eastern Africa | 96.7 /100 | #102 | Exceptional 11.3% |
| Immigrants | Uruguay | 96.4 /100 | #103 | Exceptional 11.3% |
| Immigrants | Immigrants | 96.4 /100 | #104 | Exceptional 11.3% |
| Immigrants | Kazakhstan | 96.4 /100 | #105 | Exceptional 11.3% |
| Immigrants | Eastern Europe | 96.3 /100 | #106 | Exceptional 11.3% |
| Nicaraguans | 96.2 /100 | #107 | Exceptional 11.3% |
| Immigrants | Nigeria | 96.0 /100 | #108 | Exceptional 11.3% |
| Immigrants | Uganda | 95.7 /100 | #109 | Exceptional 11.3% |
| Immigrants | Denmark | 95.6 /100 | #110 | Exceptional 11.3% |
| Immigrants | South Eastern Asia | 95.4 /100 | #111 | Exceptional 11.3% |