Carpatho Rusyn vs Yakama Disability
COMPARE
Carpatho Rusyn
Yakama
Disability
Disability Comparison
Carpatho Rusyns
Yakama
12.3%
DISABILITY
1.4/ 100
METRIC RATING
249th/ 347
METRIC RANK
13.4%
DISABILITY
0.0/ 100
METRIC RATING
304th/ 347
METRIC RANK
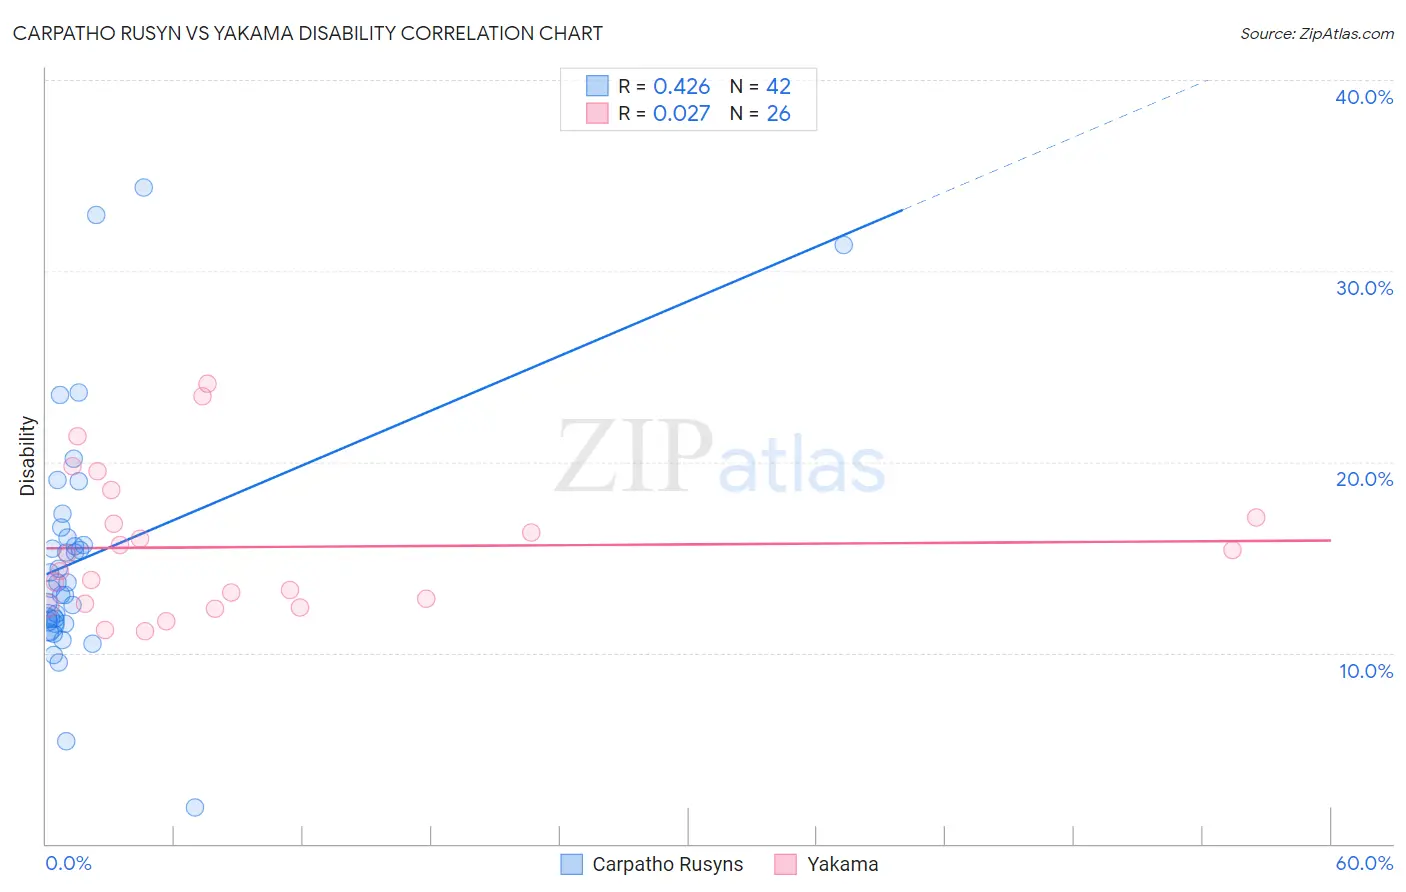
Carpatho Rusyn vs Yakama Disability Correlation Chart
The statistical analysis conducted on geographies consisting of 58,872,415 people shows a moderate positive correlation between the proportion of Carpatho Rusyns and percentage of population with a disability in the United States with a correlation coefficient (R) of 0.426 and weighted average of 12.3%. Similarly, the statistical analysis conducted on geographies consisting of 19,917,759 people shows no correlation between the proportion of Yakama and percentage of population with a disability in the United States with a correlation coefficient (R) of 0.027 and weighted average of 13.4%, a difference of 9.2%.
Disability Correlation Summary
| Measurement | Carpatho Rusyn | Yakama |
| Minimum | 1.9% | 11.1% |
| Maximum | 34.3% | 24.1% |
| Range | 32.4% | 13.0% |
| Mean | 15.0% | 15.5% |
| Median | 13.5% | 14.7% |
| Interquartile 25% (IQ1) | 11.6% | 12.6% |
| Interquartile 75% (IQ3) | 16.0% | 17.1% |
| Interquartile Range (IQR) | 4.4% | 4.5% |
| Standard Deviation (Sample) | 6.4% | 3.7% |
| Standard Deviation (Population) | 6.3% | 3.6% |
Similar Demographics by Disability
Demographics Similar to Carpatho Rusyns by Disability
In terms of disability, the demographic groups most similar to Carpatho Rusyns are Guamanian/Chamorro (12.3%, a difference of 0.010%), Subsaharan African (12.3%, a difference of 0.010%), European (12.3%, a difference of 0.010%), Indonesian (12.2%, a difference of 0.050%), and Swiss (12.2%, a difference of 0.080%).
| Demographics | Rating | Rank | Disability |
| Poles | 1.7 /100 | #242 | Tragic 12.2% |
| British | 1.5 /100 | #243 | Tragic 12.2% |
| Basques | 1.5 /100 | #244 | Tragic 12.2% |
| Liberians | 1.5 /100 | #245 | Tragic 12.2% |
| Swiss | 1.5 /100 | #246 | Tragic 12.2% |
| Indonesians | 1.4 /100 | #247 | Tragic 12.2% |
| Guamanians/Chamorros | 1.4 /100 | #248 | Tragic 12.3% |
| Carpatho Rusyns | 1.4 /100 | #249 | Tragic 12.3% |
| Sub-Saharan Africans | 1.4 /100 | #250 | Tragic 12.3% |
| Europeans | 1.4 /100 | #251 | Tragic 12.3% |
| Bermudans | 1.1 /100 | #252 | Tragic 12.3% |
| Belgians | 0.8 /100 | #253 | Tragic 12.3% |
| German Russians | 0.8 /100 | #254 | Tragic 12.3% |
| Slovenes | 0.6 /100 | #255 | Tragic 12.4% |
| Immigrants | Dominica | 0.6 /100 | #256 | Tragic 12.4% |
Demographics Similar to Yakama by Disability
In terms of disability, the demographic groups most similar to Yakama are French Canadian (13.4%, a difference of 0.35%), Scotch-Irish (13.3%, a difference of 0.47%), Cape Verdean (13.5%, a difference of 0.95%), Shoshone (13.5%, a difference of 1.0%), and French American Indian (13.5%, a difference of 1.1%).
| Demographics | Rating | Rank | Disability |
| Hopi | 0.0 /100 | #297 | Tragic 13.2% |
| Alaska Natives | 0.0 /100 | #298 | Tragic 13.2% |
| French | 0.0 /100 | #299 | Tragic 13.2% |
| Pennsylvania Germans | 0.0 /100 | #300 | Tragic 13.2% |
| Immigrants | Micronesia | 0.0 /100 | #301 | Tragic 13.2% |
| Arapaho | 0.0 /100 | #302 | Tragic 13.2% |
| Scotch-Irish | 0.0 /100 | #303 | Tragic 13.3% |
| Yakama | 0.0 /100 | #304 | Tragic 13.4% |
| French Canadians | 0.0 /100 | #305 | Tragic 13.4% |
| Cape Verdeans | 0.0 /100 | #306 | Tragic 13.5% |
| Shoshone | 0.0 /100 | #307 | Tragic 13.5% |
| French American Indians | 0.0 /100 | #308 | Tragic 13.5% |
| Tlingit-Haida | 0.0 /100 | #309 | Tragic 13.5% |
| Blackfeet | 0.0 /100 | #310 | Tragic 13.6% |
| Delaware | 0.0 /100 | #311 | Tragic 13.6% |