Swedish vs Immigrants from South Africa Disability
COMPARE
Swedish
Immigrants from South Africa
Disability
Disability Comparison
Swedes
Immigrants from South Africa
12.2%
DISABILITY
1.8/ 100
METRIC RATING
239th/ 347
METRIC RANK
11.2%
DISABILITY
98.2/ 100
METRIC RATING
89th/ 347
METRIC RANK
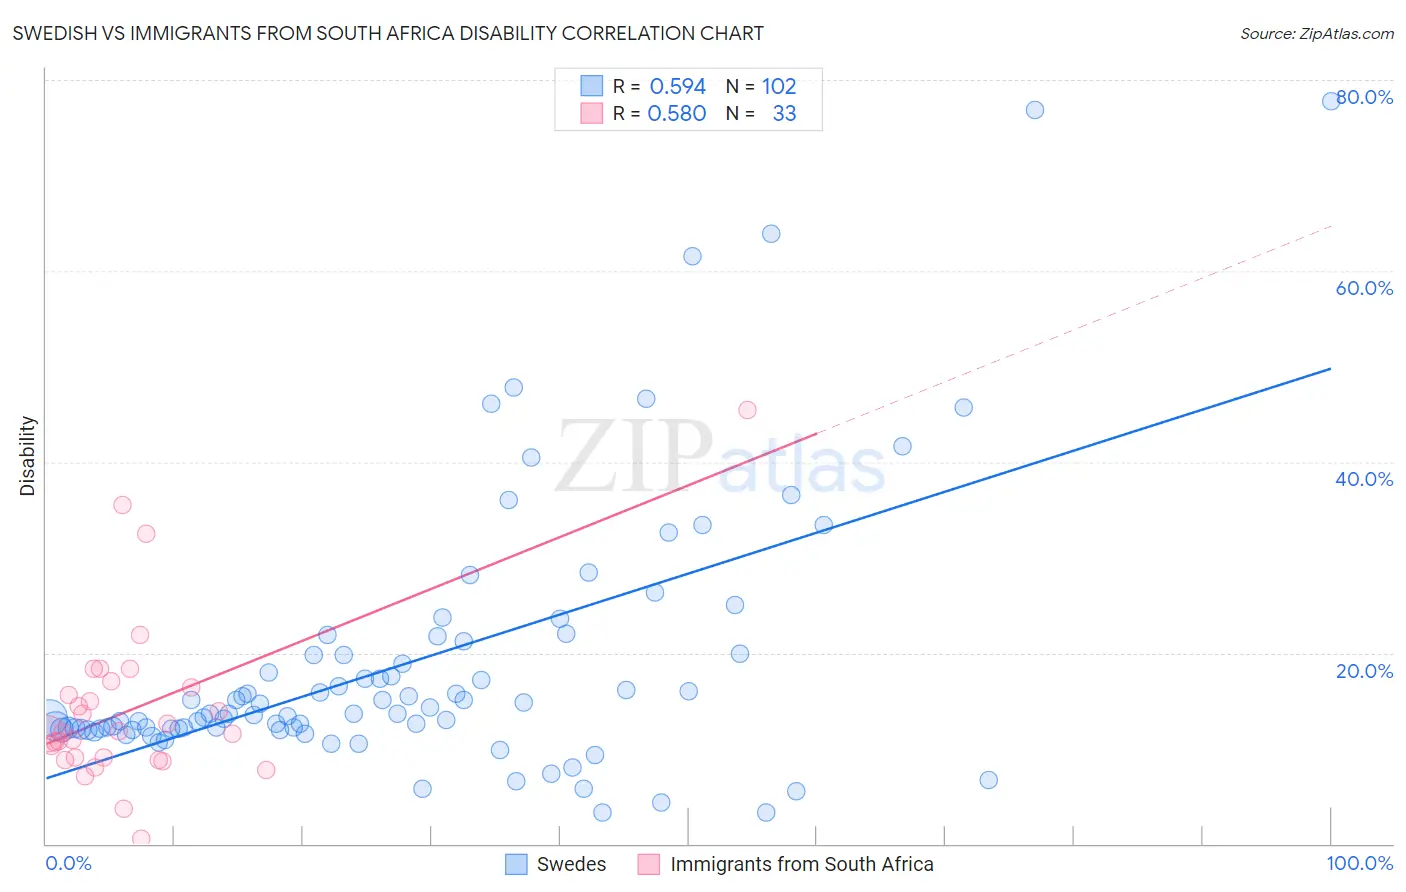
Swedish vs Immigrants from South Africa Disability Correlation Chart
The statistical analysis conducted on geographies consisting of 539,139,641 people shows a substantial positive correlation between the proportion of Swedes and percentage of population with a disability in the United States with a correlation coefficient (R) of 0.594 and weighted average of 12.2%. Similarly, the statistical analysis conducted on geographies consisting of 233,313,219 people shows a substantial positive correlation between the proportion of Immigrants from South Africa and percentage of population with a disability in the United States with a correlation coefficient (R) of 0.580 and weighted average of 11.2%, a difference of 9.3%.
Disability Correlation Summary
| Measurement | Swedish | Immigrants from South Africa |
| Minimum | 3.3% | 0.46% |
| Maximum | 77.8% | 45.5% |
| Range | 74.5% | 45.0% |
| Mean | 19.0% | 14.2% |
| Median | 13.6% | 11.7% |
| Interquartile 25% (IQ1) | 12.0% | 8.9% |
| Interquartile 75% (IQ3) | 19.9% | 16.7% |
| Interquartile Range (IQR) | 8.0% | 7.8% |
| Standard Deviation (Sample) | 14.2% | 8.9% |
| Standard Deviation (Population) | 14.1% | 8.8% |
Similar Demographics by Disability
Demographics Similar to Swedes by Disability
In terms of disability, the demographic groups most similar to Swedes are Norwegian (12.2%, a difference of 0.040%), Hungarian (12.2%, a difference of 0.050%), Yugoslavian (12.2%, a difference of 0.050%), Immigrants from Congo (12.2%, a difference of 0.080%), and Polish (12.2%, a difference of 0.080%).
| Demographics | Rating | Rank | Disability |
| Italians | 2.5 /100 | #232 | Tragic 12.2% |
| Bahamians | 2.3 /100 | #233 | Tragic 12.2% |
| Japanese | 2.3 /100 | #234 | Tragic 12.2% |
| Yup'ik | 2.2 /100 | #235 | Tragic 12.2% |
| Chinese | 2.0 /100 | #236 | Tragic 12.2% |
| Immigrants | Congo | 1.9 /100 | #237 | Tragic 12.2% |
| Norwegians | 1.9 /100 | #238 | Tragic 12.2% |
| Swedes | 1.8 /100 | #239 | Tragic 12.2% |
| Hungarians | 1.7 /100 | #240 | Tragic 12.2% |
| Yugoslavians | 1.7 /100 | #241 | Tragic 12.2% |
| Poles | 1.7 /100 | #242 | Tragic 12.2% |
| British | 1.5 /100 | #243 | Tragic 12.2% |
| Basques | 1.5 /100 | #244 | Tragic 12.2% |
| Liberians | 1.5 /100 | #245 | Tragic 12.2% |
| Swiss | 1.5 /100 | #246 | Tragic 12.2% |
Demographics Similar to Immigrants from South Africa by Disability
In terms of disability, the demographic groups most similar to Immigrants from South Africa are Immigrants from Brazil (11.2%, a difference of 0.050%), Immigrants from Western Asia (11.2%, a difference of 0.070%), Ecuadorian (11.2%, a difference of 0.11%), Immigrants from Ecuador (11.2%, a difference of 0.11%), and Immigrants from Morocco (11.2%, a difference of 0.23%).
| Demographics | Rating | Rank | Disability |
| Chileans | 99.1 /100 | #82 | Exceptional 11.1% |
| Immigrants | Switzerland | 99.0 /100 | #83 | Exceptional 11.1% |
| Immigrants | Sierra Leone | 99.0 /100 | #84 | Exceptional 11.1% |
| Immigrants | Belarus | 98.9 /100 | #85 | Exceptional 11.1% |
| Immigrants | Russia | 98.9 /100 | #86 | Exceptional 11.1% |
| Palestinians | 98.9 /100 | #87 | Exceptional 11.1% |
| Immigrants | Romania | 98.5 /100 | #88 | Exceptional 11.2% |
| Immigrants | South Africa | 98.2 /100 | #89 | Exceptional 11.2% |
| Immigrants | Brazil | 98.1 /100 | #90 | Exceptional 11.2% |
| Immigrants | Western Asia | 98.1 /100 | #91 | Exceptional 11.2% |
| Ecuadorians | 98.0 /100 | #92 | Exceptional 11.2% |
| Immigrants | Ecuador | 98.0 /100 | #93 | Exceptional 11.2% |
| Immigrants | Morocco | 97.8 /100 | #94 | Exceptional 11.2% |
| Eastern Europeans | 97.8 /100 | #95 | Exceptional 11.2% |
| Immigrants | Zimbabwe | 97.7 /100 | #96 | Exceptional 11.2% |