Swedish vs Cypriot Disability
COMPARE
Swedish
Cypriot
Disability
Disability Comparison
Swedes
Cypriots
12.2%
DISABILITY
1.8/ 100
METRIC RATING
239th/ 347
METRIC RANK
10.6%
DISABILITY
100.0/ 100
METRIC RATING
27th/ 347
METRIC RANK
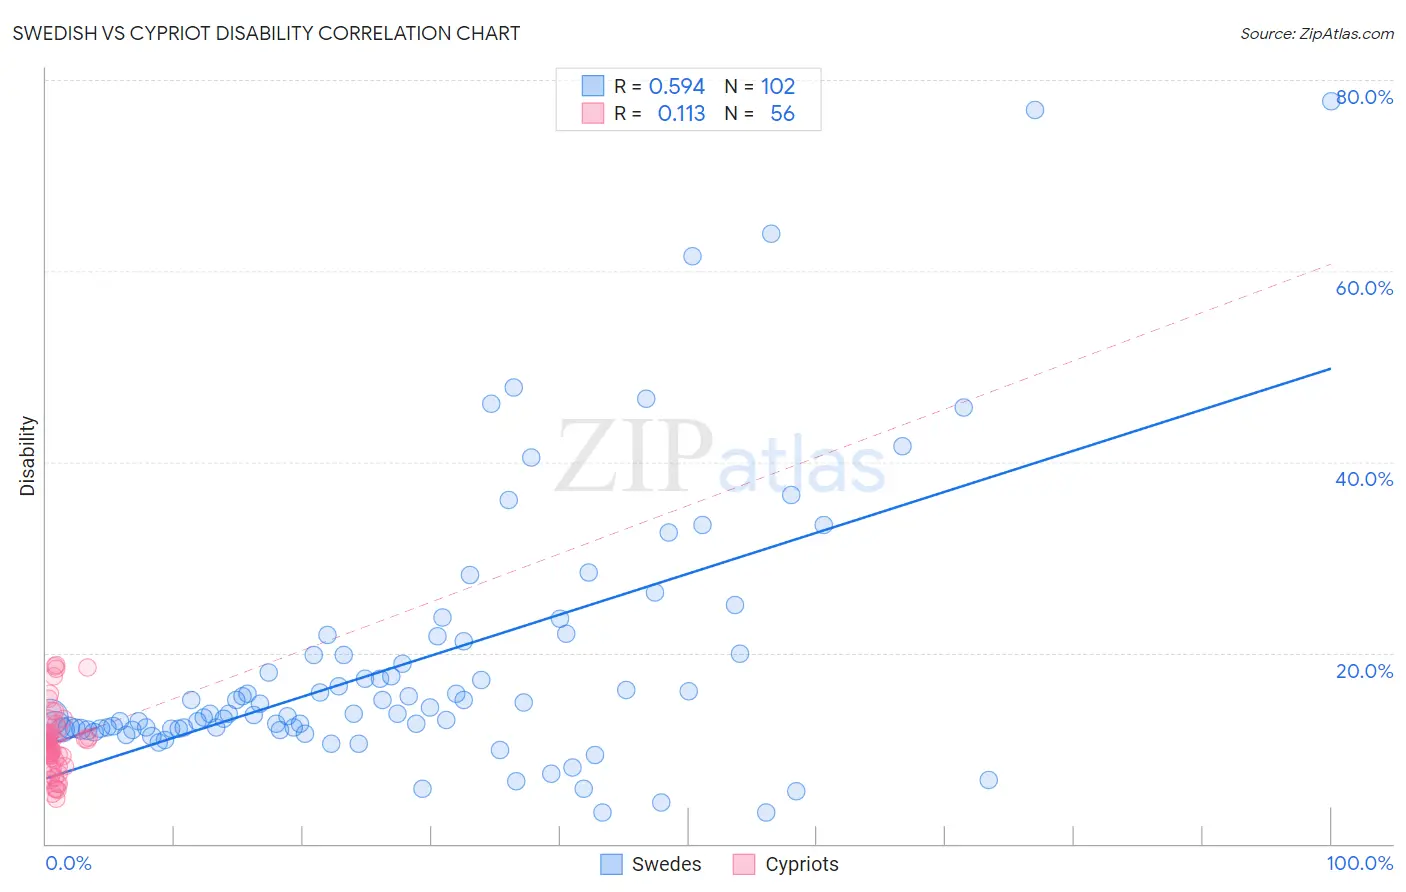
Swedish vs Cypriot Disability Correlation Chart
The statistical analysis conducted on geographies consisting of 539,139,641 people shows a substantial positive correlation between the proportion of Swedes and percentage of population with a disability in the United States with a correlation coefficient (R) of 0.594 and weighted average of 12.2%. Similarly, the statistical analysis conducted on geographies consisting of 61,867,698 people shows a poor positive correlation between the proportion of Cypriots and percentage of population with a disability in the United States with a correlation coefficient (R) of 0.113 and weighted average of 10.6%, a difference of 15.4%.
Disability Correlation Summary
| Measurement | Swedish | Cypriot |
| Minimum | 3.3% | 4.7% |
| Maximum | 77.8% | 18.7% |
| Range | 74.5% | 14.0% |
| Mean | 19.0% | 10.5% |
| Median | 13.6% | 10.3% |
| Interquartile 25% (IQ1) | 12.0% | 8.1% |
| Interquartile 75% (IQ3) | 19.9% | 11.6% |
| Interquartile Range (IQR) | 8.0% | 3.5% |
| Standard Deviation (Sample) | 14.2% | 3.5% |
| Standard Deviation (Population) | 14.1% | 3.4% |
Similar Demographics by Disability
Demographics Similar to Swedes by Disability
In terms of disability, the demographic groups most similar to Swedes are Norwegian (12.2%, a difference of 0.040%), Hungarian (12.2%, a difference of 0.050%), Yugoslavian (12.2%, a difference of 0.050%), Immigrants from Congo (12.2%, a difference of 0.080%), and Polish (12.2%, a difference of 0.080%).
| Demographics | Rating | Rank | Disability |
| Italians | 2.5 /100 | #232 | Tragic 12.2% |
| Bahamians | 2.3 /100 | #233 | Tragic 12.2% |
| Japanese | 2.3 /100 | #234 | Tragic 12.2% |
| Yup'ik | 2.2 /100 | #235 | Tragic 12.2% |
| Chinese | 2.0 /100 | #236 | Tragic 12.2% |
| Immigrants | Congo | 1.9 /100 | #237 | Tragic 12.2% |
| Norwegians | 1.9 /100 | #238 | Tragic 12.2% |
| Swedes | 1.8 /100 | #239 | Tragic 12.2% |
| Hungarians | 1.7 /100 | #240 | Tragic 12.2% |
| Yugoslavians | 1.7 /100 | #241 | Tragic 12.2% |
| Poles | 1.7 /100 | #242 | Tragic 12.2% |
| British | 1.5 /100 | #243 | Tragic 12.2% |
| Basques | 1.5 /100 | #244 | Tragic 12.2% |
| Liberians | 1.5 /100 | #245 | Tragic 12.2% |
| Swiss | 1.5 /100 | #246 | Tragic 12.2% |
Demographics Similar to Cypriots by Disability
In terms of disability, the demographic groups most similar to Cypriots are Argentinean (10.6%, a difference of 0.010%), Immigrants from Malaysia (10.6%, a difference of 0.060%), Egyptian (10.6%, a difference of 0.13%), Immigrants from Argentina (10.6%, a difference of 0.26%), and Immigrants from Turkey (10.6%, a difference of 0.41%).
| Demographics | Rating | Rank | Disability |
| Immigrants | Venezuela | 100.0 /100 | #20 | Exceptional 10.4% |
| Asians | 100.0 /100 | #21 | Exceptional 10.4% |
| Immigrants | Sri Lanka | 100.0 /100 | #22 | Exceptional 10.5% |
| Immigrants | Asia | 100.0 /100 | #23 | Exceptional 10.5% |
| Venezuelans | 100.0 /100 | #24 | Exceptional 10.5% |
| Immigrants | Malaysia | 100.0 /100 | #25 | Exceptional 10.6% |
| Argentineans | 100.0 /100 | #26 | Exceptional 10.6% |
| Cypriots | 100.0 /100 | #27 | Exceptional 10.6% |
| Egyptians | 100.0 /100 | #28 | Exceptional 10.6% |
| Immigrants | Argentina | 100.0 /100 | #29 | Exceptional 10.6% |
| Immigrants | Turkey | 100.0 /100 | #30 | Exceptional 10.6% |
| Immigrants | Egypt | 100.0 /100 | #31 | Exceptional 10.6% |
| Paraguayans | 100.0 /100 | #32 | Exceptional 10.6% |
| Immigrants | Kuwait | 100.0 /100 | #33 | Exceptional 10.7% |
| Immigrants | Ethiopia | 100.0 /100 | #34 | Exceptional 10.7% |